


Gold Price - XAU/USD Technical Analysis
- Will Bulls keep controlling the price action?
- Signals and levels to monitor on the short term
Gold Soars to a Multi- Year High
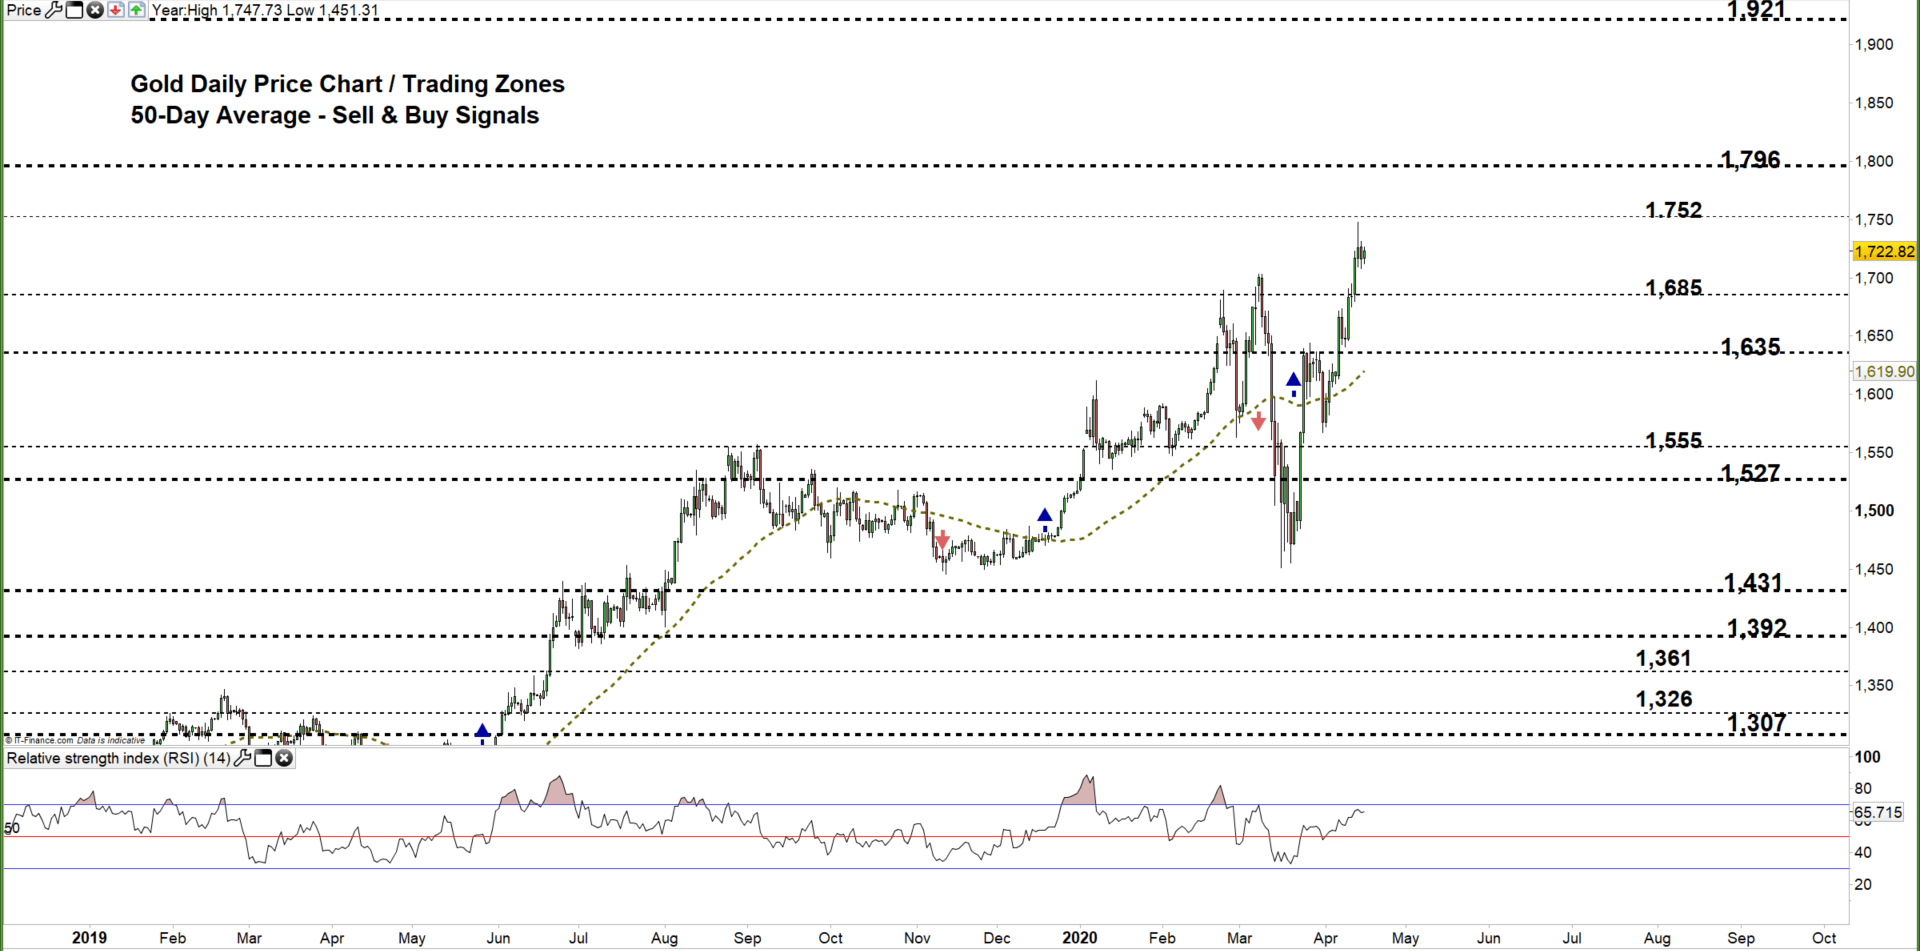
On Thursday, Gold printed it highest level in over four weeks at $1,690 then retreated after. Yet, the weekly candlestick closed with nearly 4% gain. This week, the market has resumed bullish price action and rebounded from $1,747 – its highest level in over seven years. The price fell after as some bulls seemed to cut back.
This week, the Relative Strength Index (RSI) rose 66 then remained flat, signaling a paused uptrend move.
Gold DAILY PRICE CHART (DEC 9, 2018 – April 16, 2020) Zoomed out

Gold DAILY PRICE CHART (JAN 25 – April 16, 2020) Zoomed In
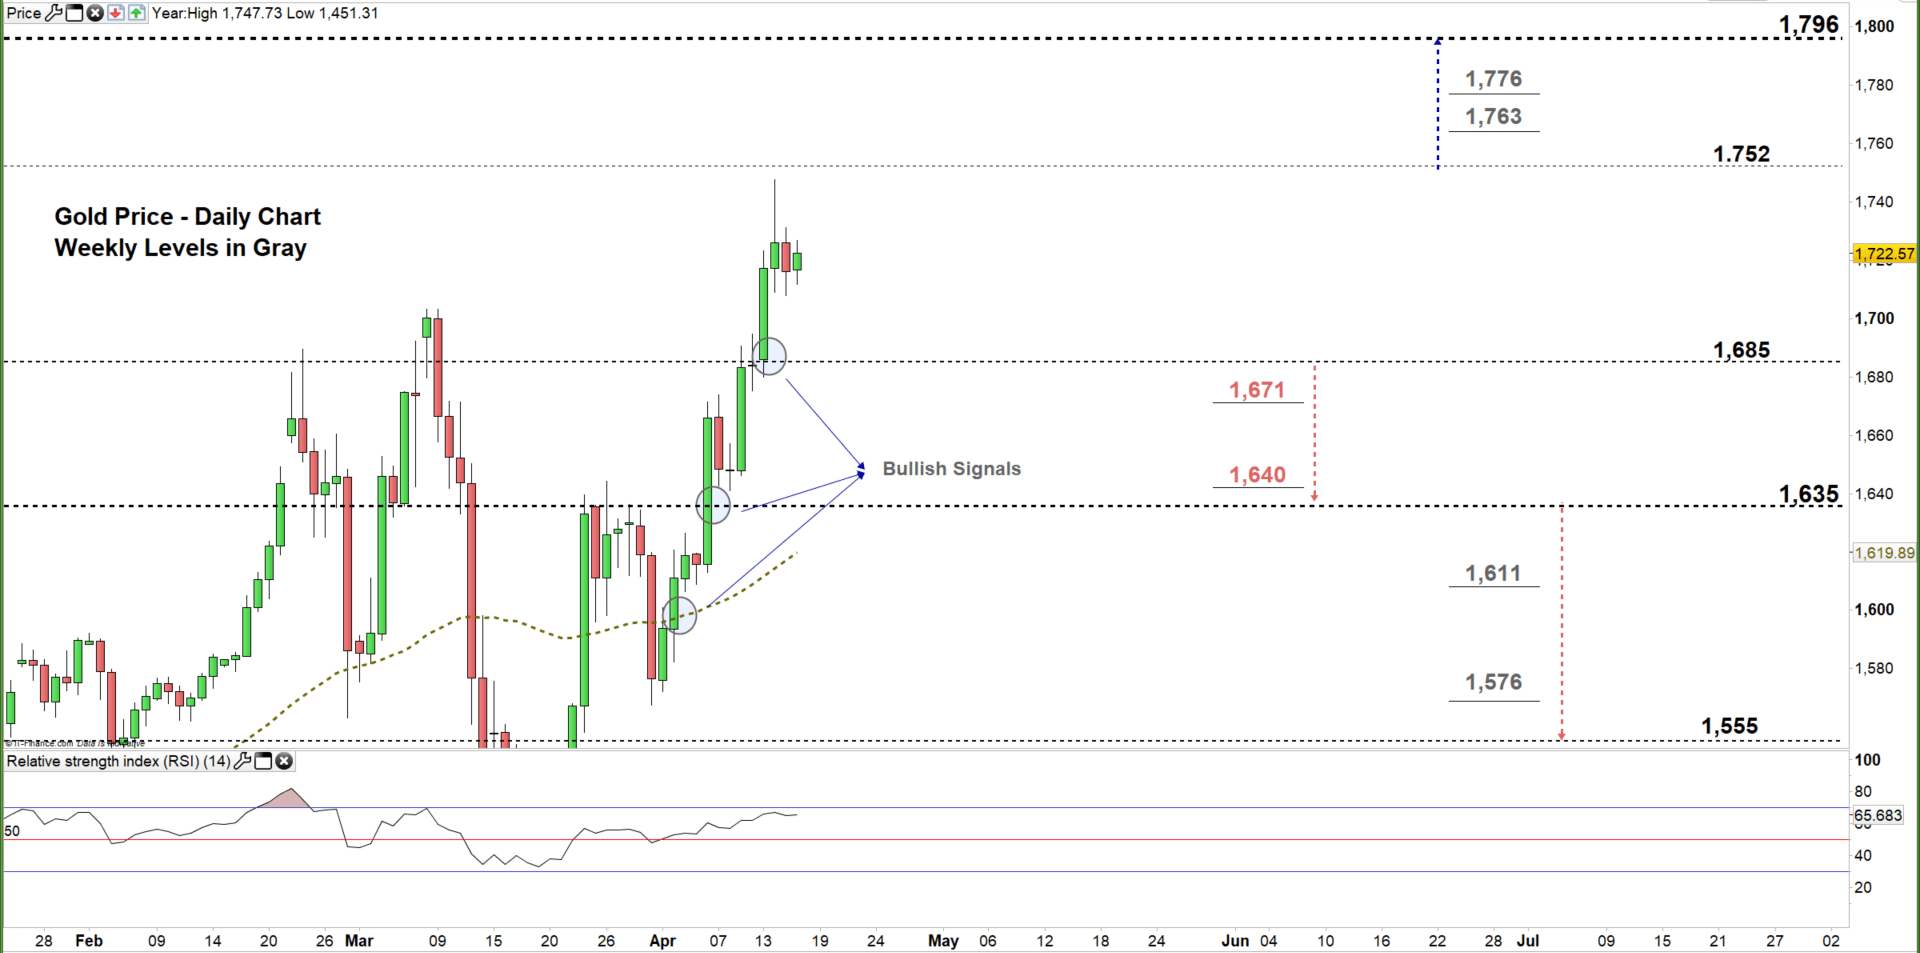
Looking at the daily chart, we noticed that on April 2 Gold rallied then closed above the 50-day average generating a bullish signal. Since then, the price took off looking for a test of the monthly resistance at $1,703 as discussed in our last update . On Monday, the market climbed to current trading zone $1,685 - $1,752. However, in the following day XAU/USD U-turned eyeing a test of the low end of the zone.
Thus, a close below the low end of the zone reflects bulls hesitation. This could send Gold towards $1,635. Further close below that level may lead the price even lower towards $1,555. Having said that, the daily and weekly support levels underlined on the chart (zoomed in) should be considered.
In turn, any failure in closing below the low end may reverse the market’s direction towards the high end of the zone. Further close above that level could encourage bulls to push towards $1,796. In that scenario, the monthly resistance levels marked on the chart should be watched closely.

Gold Four-HOUR PRICE CHART (April 2 – April 16, 2020)
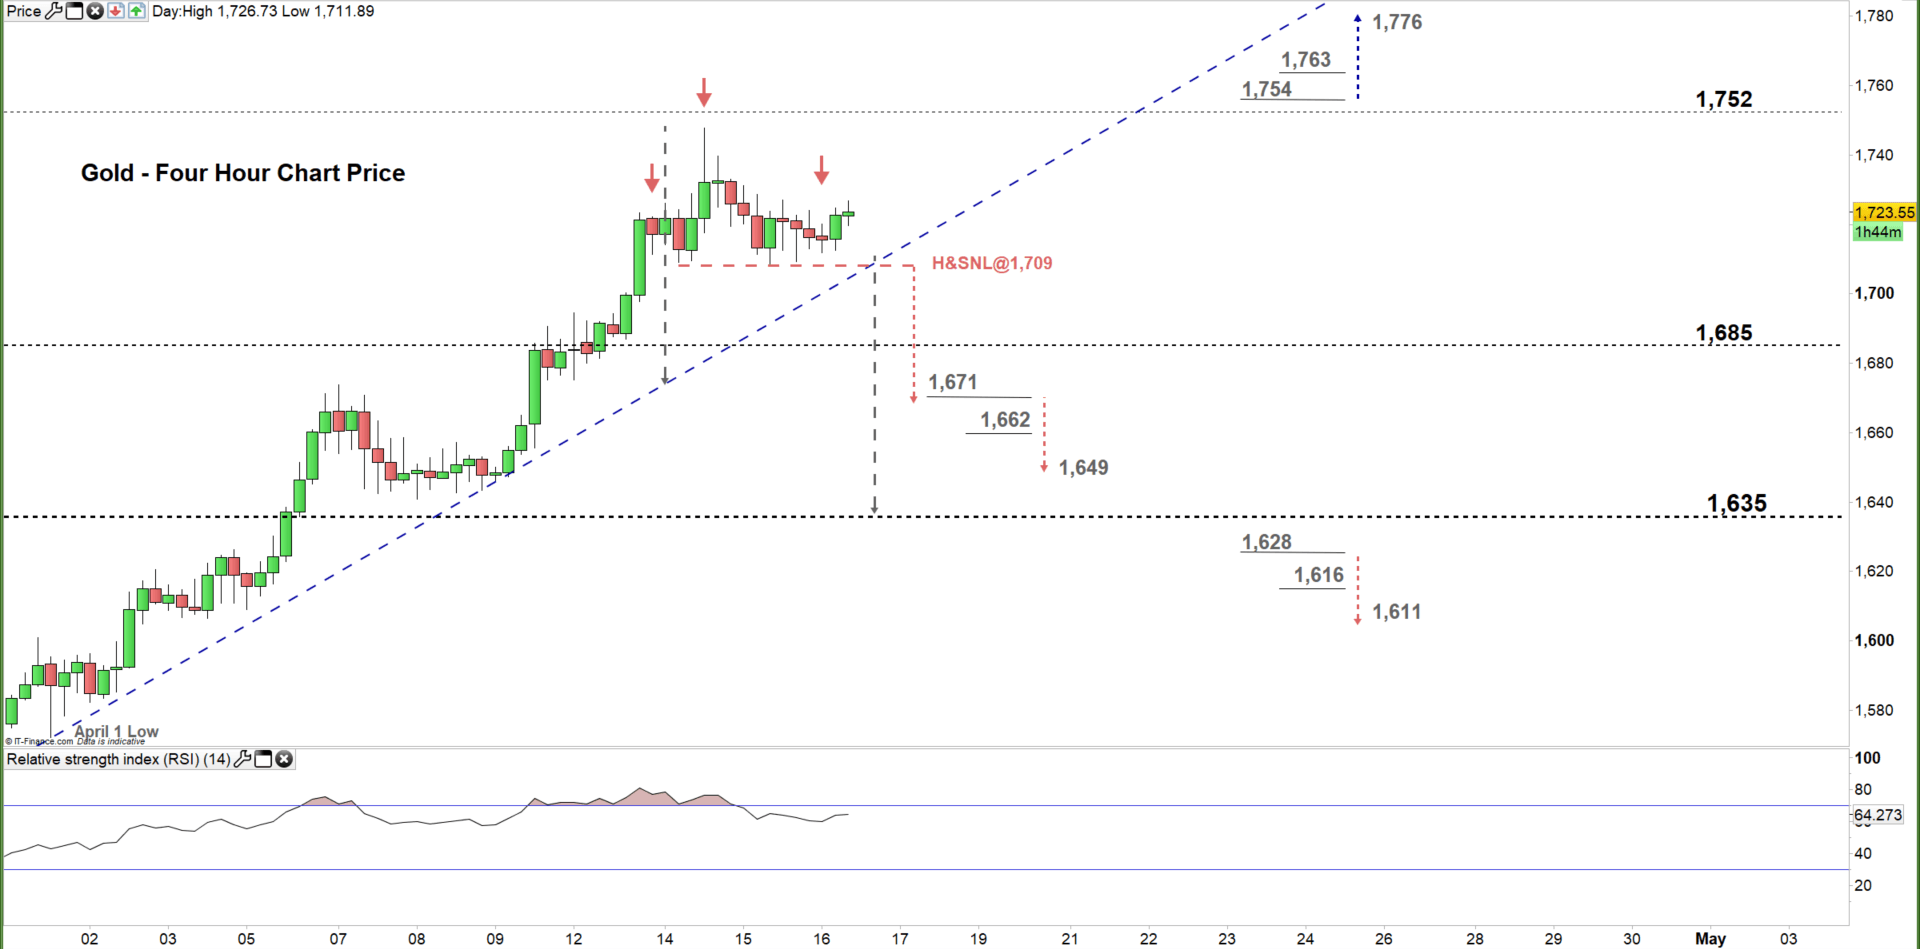
From the four-hour chart, we noticed that currently XAU/USD trades above the uptrend line originated from the April 1 low at $1,572. Any violation to the uptrend line would be a bearish signal and possibly send the price towards $1,635.
Additionally, we spotted on the chart a head and shoulders pattern. Therefore, any violation to the neckline residing at $1,709 might lead Gold towards $1,671.
A break below $1,671 would be another bearish signal. This increases the likelihood of falling towards $1,649. Although, the daily support level underscored on the chart should be monitored. In turn, any break in the other direction i.e. above $1,754 may cause a rally towards $1,776 . Nevertheless, the monthly resistance level printed on the chart should be kept in focus.
See the chart to find out more about key technical levels in a further bullish / bearish scenario.

Written By: Mahmoud Alkudsi


