


Gold Technical Price Outlook: XAU/USD Near-term Trade Levels
- Gold price updated technical trade levels – Daily & Intraday Charts
- XAU/USD breakout eases back from uptrend resistance- outlook constructive while above 1586
- New to Gold Trading? Get started with this Free How to Trade Gold -Beginners Guide
Gold prices are on the defensive early in the week after posting a monthly range of more than 9.1% to fresh seven-year highs last week (largest monthly range since August). While the broader outlook remains weighted to the topside, the advance may still be vulnerable near-term with a larger pullback to ultimately offer more favorable opportunities closer to trend support. These are the updated targets and invalidation levels that matter on the XAU/USD charts. Review my latest Weekly Strategy Webinar for an in-depth breakdown of this gold trade setup and more.
Gold Price Chart - XAU/USD Daily
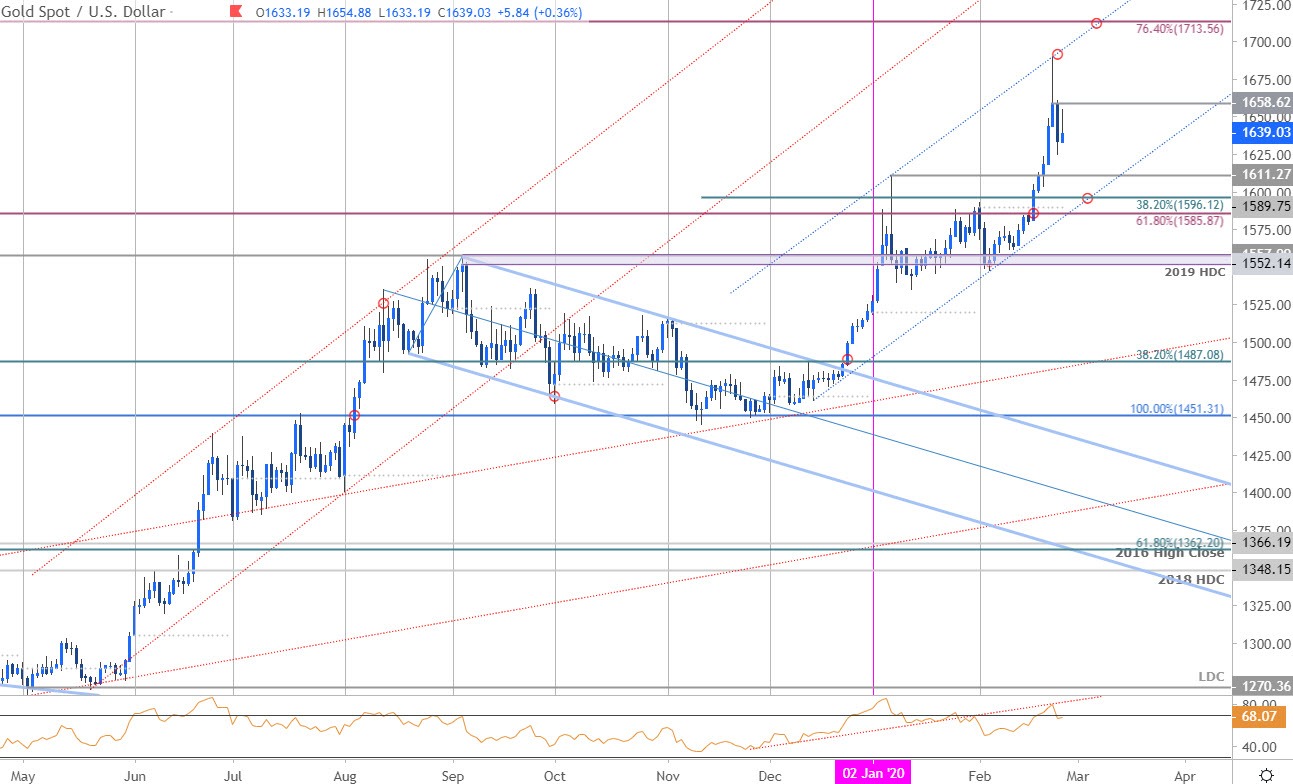
Chart Prepared by Michael Boutros, Technical Strategist; Gold on Tradingview
Technical Outlook: In my last Gold Price Outlook we noted, “critical resistance at 1582/86and the objective monthly open at 1590- a close above this threshold is needed to mark resumption of the broader uptrend.” XAU/USD broke higher a week later with the advance fueling a rally of more than 5.5% before pulling back sharply on Monday. The move takes daily momentum back below the 70-threshold and while the broader focus remains weighted to the topside, the immediate advance may be vulnerable here after this stretch. Daily resistance now stands with the high-day close at 1658 – a close above is needed to mark resumption with the next major resistance hurdle at the 76.4% retracement at 1713.
Gold Price Chart - XAU/USD 240min

Notes: A closer look at Gold price action sees XAU/USD trading within the confines of a near-term ascending pitchfork formation with the upper parallel capping the recent breakout near 1689. The pullback is now testing the median-line as support and we’re looking for a reaction here – a break lower would keep the focus on a deeper correction with subsequent support objectives eyed at 1611, 1596 and the 61.8% retracement at 1586 – both levels of interest for possible downside exhaustion IF reached. Weekly open resistance stands at 1643 backed closely by the high-day close at 1658- ultimately a breach above this threshold would shift the focus back towards the upper parallel / stretch highs at 1689 and 1713.

Bottom line: The gold breakout is vulnerable here near-term after rallying more than 11% since the start of the year. From a trading standpoint, the risk remains for a deeper setback while below the high-day close but be on the lookout for possible downside exhaustion on test of the lower parallel / uptrend support for possible entries. Review my latest Gold Weekly Price Outlook for a closer look at the longer-term XAU/USD technical trading levels. .
For a complete breakdown of Michael’s trading strategy, review his Foundations of Technical Analysis series on Building a Trading Strategy
Gold Trader Sentiment – XAU/USD Price Chart
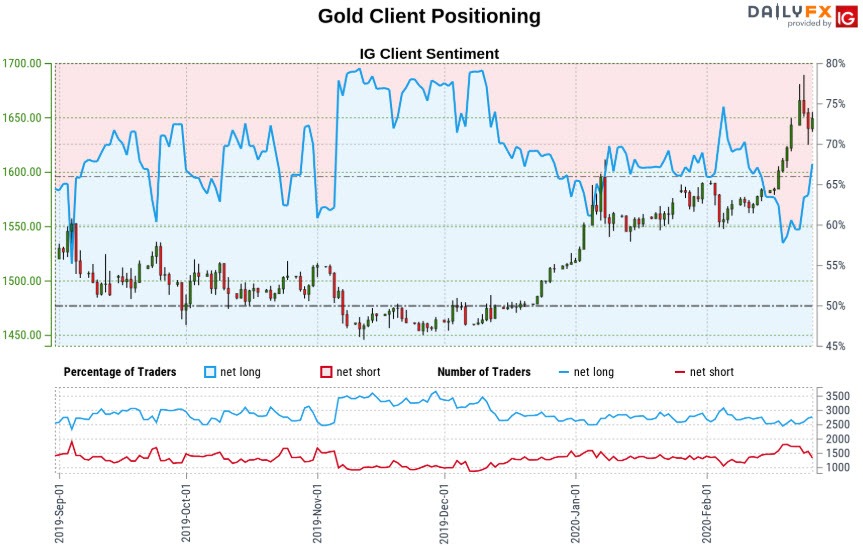
- A summary of IG Client Sentiment shows traders are net-long Gold- the ratio stands at +2.22 (68.98% of traders are long) – bearishreading
- Long positions are13.44% higher than yesterday and 18.02% higher from lastweek
- Short positions are 10.30% lower than yesterday and 23.17% lower from last week
- We typically take a contrarian view to crowd sentiment, and the fact traders are net-long suggests Gold prices may continue to fall. Traders are further net-long than yesterday and last week, and the combination of current positioning and recent changes gives us a stronger Gold-bearish contrarian trading bias from a sentiment standpoint.
| Change in | Longs | Shorts | OI |
| Daily | -1% | -3% | -2% |
| Weekly | 6% | -11% | -2% |
---
Active Trade Setups
- Sterling Price Outlook: British Pound Threatens GBP/USD Breakout
- Canadian Dollar Price Outlook: Loonie Presses USD/CAD Towards Support
- Oil Price Outlook: Crude Slips into Support– WTI Trade Levels
- Euro Price Outlook: EUR/USD Spirals into Support– Trade Levels
- Australian Dollar Price Outlook: Aussie Bears Stalls- Reversal Risk
- Written by Michael Boutros, Currency Strategist with DailyFX
Follow Michael on Twitter @MBForex


