


Gold Price Forecast Highlights:
- Gold price near-term chart appears set up for sellers
- Long-term bull-flag is still very much alive
Gold price near-term chart appears set up for sellers
Since the decline during the first half of the month, gold price hasn’t been able to put together much of a rally, leading to the conclusion that another leg lower could be nearing. Counter moves lacking momentum are a form of confirmation that the prior leg (lower in this case) is the path of least resistance.
With that in mind, we could soon see the corrective-looking formation taking on the shape of an ascending wedge (visible on the 4-hr) trigger and give sellers the upper hand once again. On a swing lower there is small, short-term support around 1456, followed by the monthly low at 1445.
Gold Price 4-hr Chart (wedge coming to view)
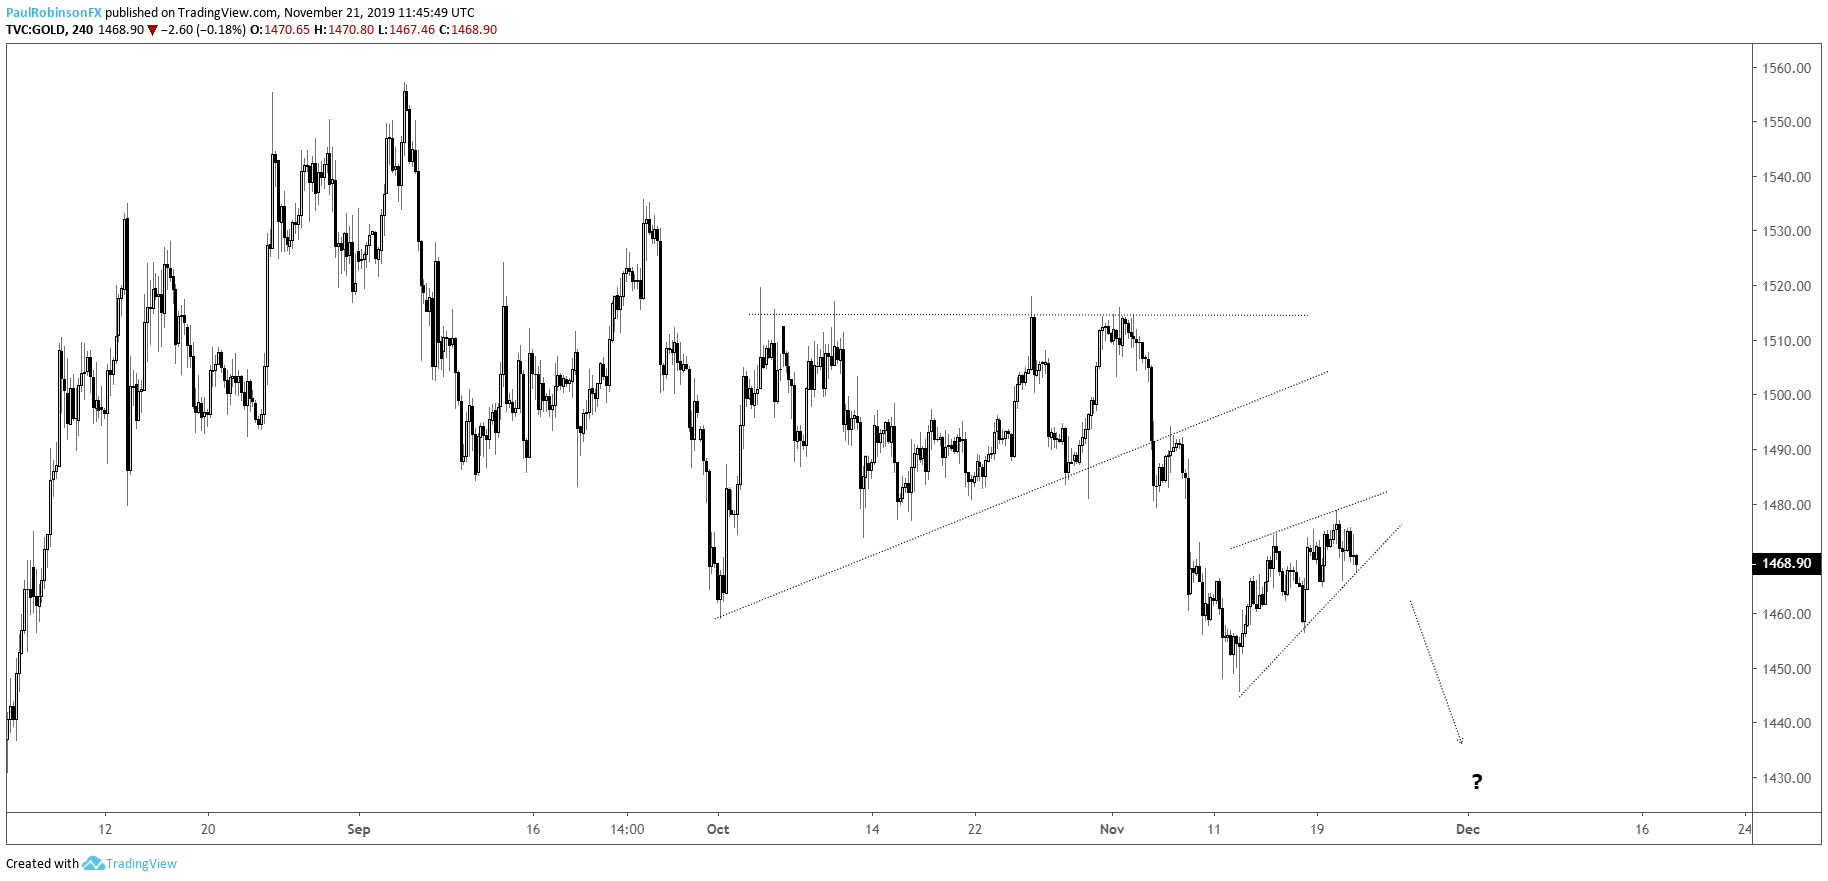
Gold Price Chart by TradingView
A break below this month’s low may be truncated as another form of support will quickly come into play via the underside parallel of the bull-flag developing since gold peaked back in September. Allowing for some latitude to see how the market responds, the support zone clocks in at 1430/20.
Trading Forecasts and Educational Guides for traders of all experience levels can be found on the DailyFX Trading Guides page.
Gold Price Daily Chart (set up for move into low-end of bull-flag)
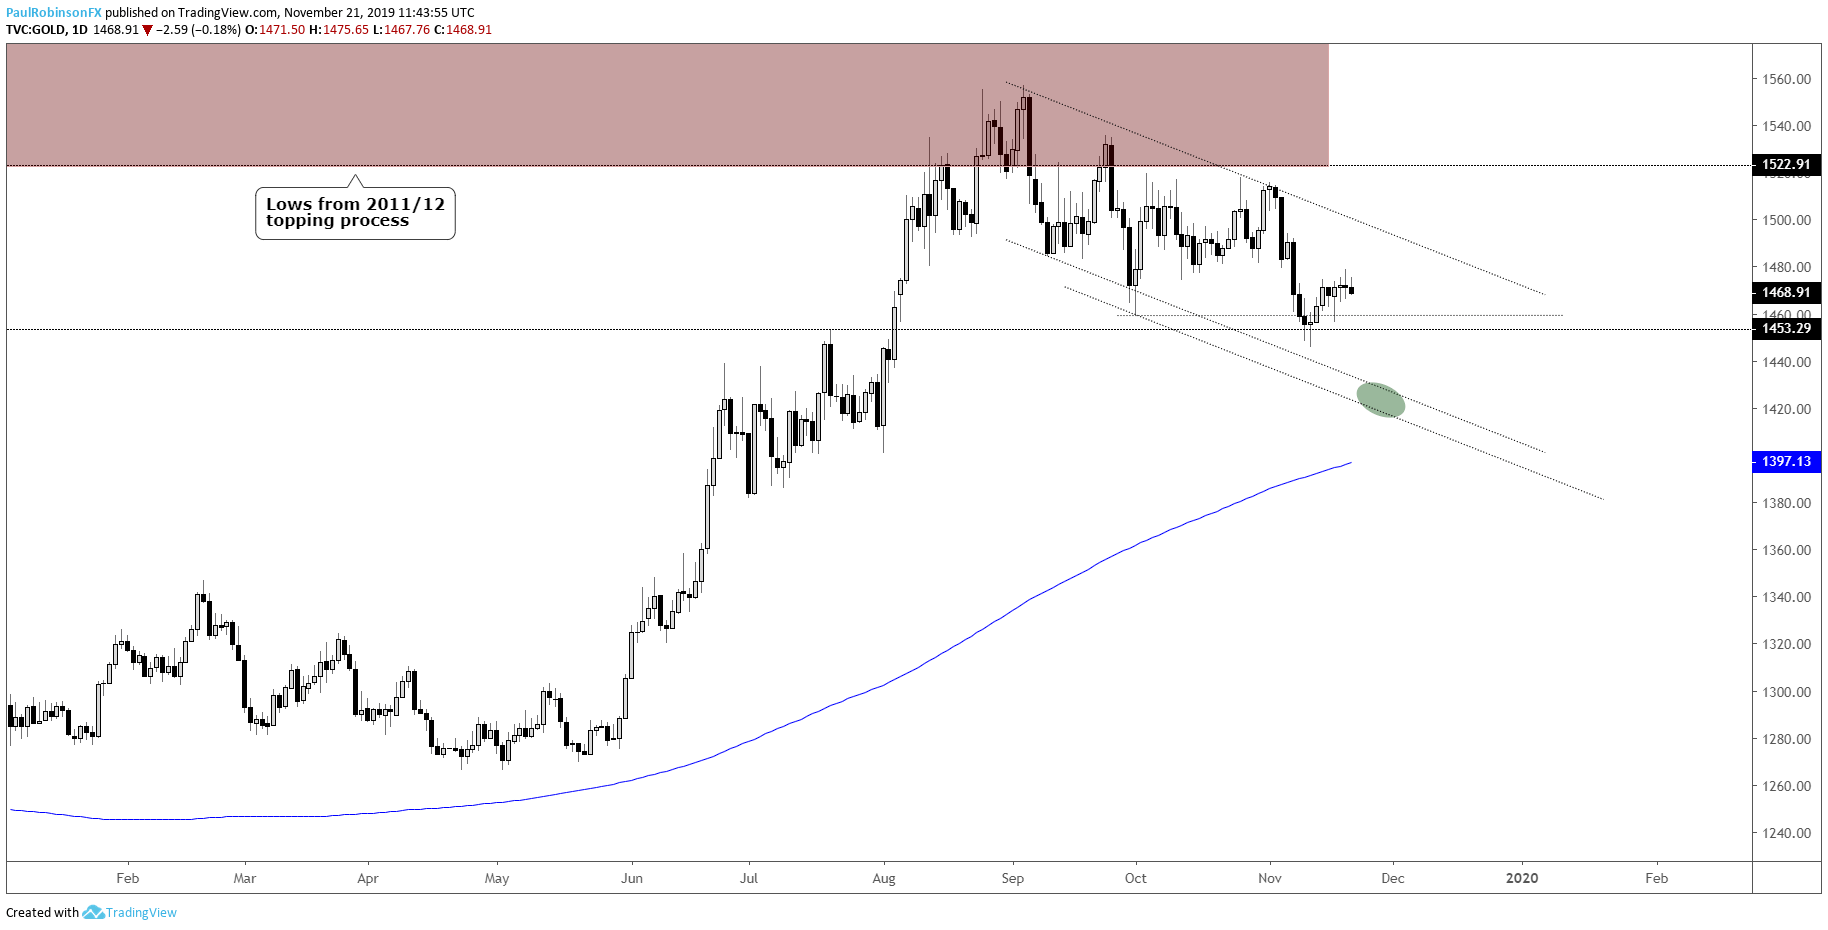
Gold Price Chart by TradingView
For the broader outlook to remain constructive through the lens of a bull-flag, it would be important for selling to dry up around the lower parallel off the pattern. Ideally, another forceful rejection is the result, similar to the one that marked the October 1 low.
For the bull-flag to get into motion the top-side parallel of the pattern will need to be crossed, something that may have to wait until early next year. For now, running with a bearish bias on the breakdown from a short-term ascending wedge, but keeping in mind at some point things could turn broadly bullish again.
Gold Price Weekly Chart (2011/12 levels key to longer-term)
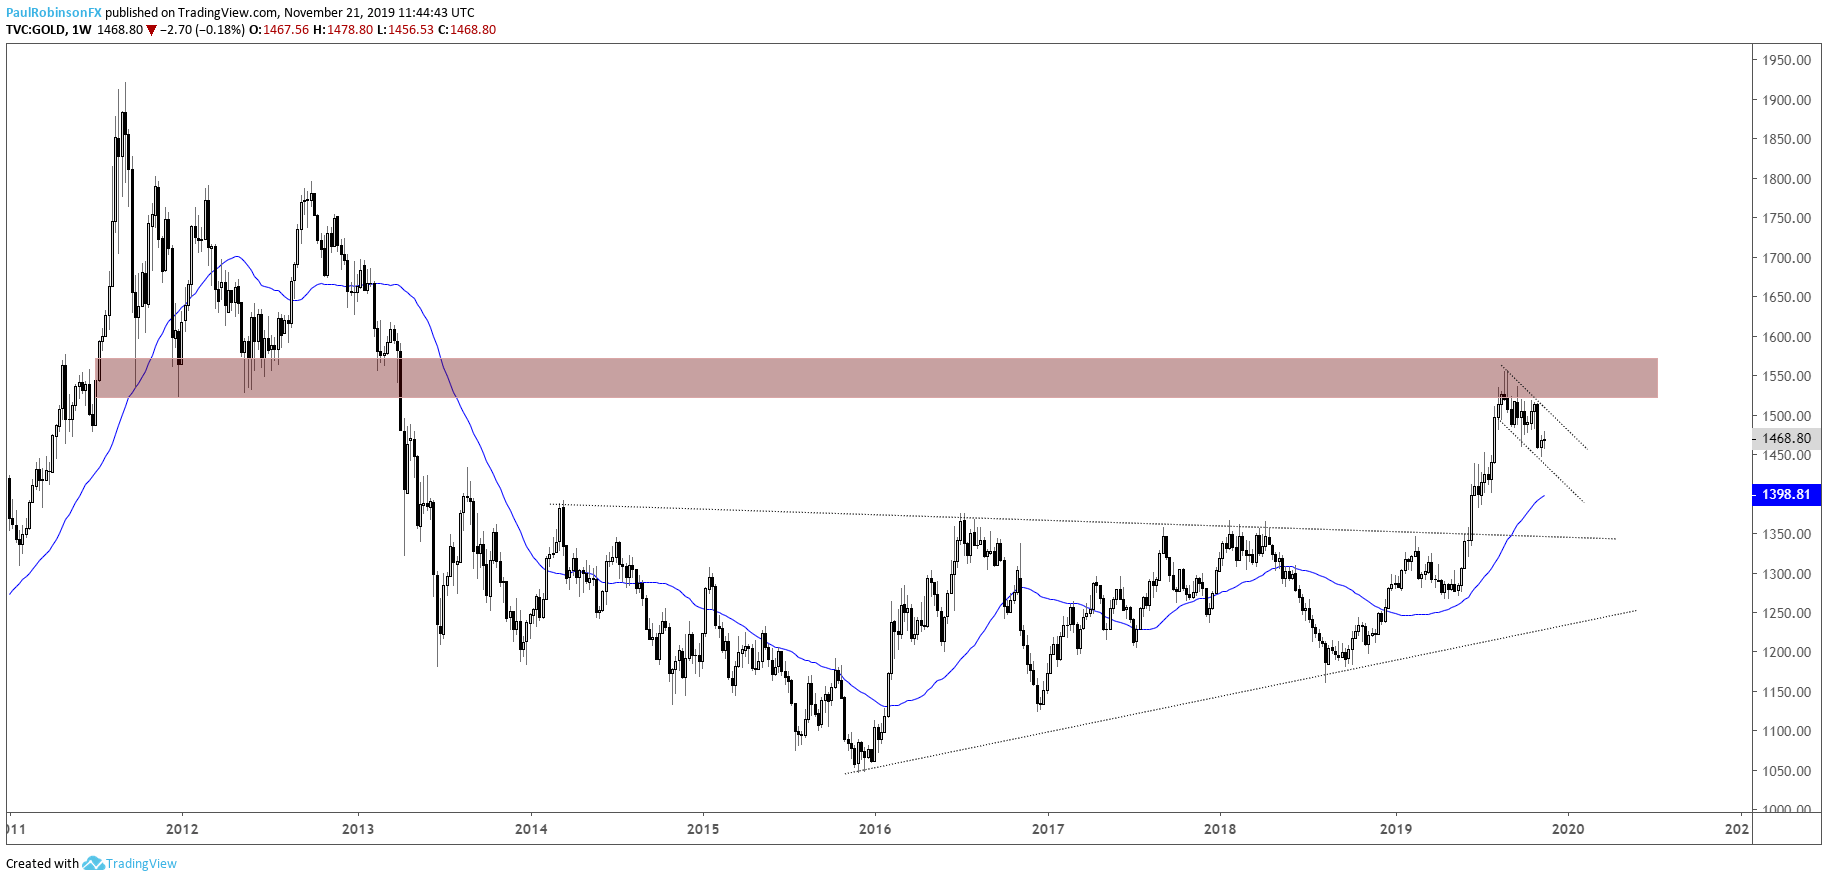
Gold Price Chart by TradingView
***Updates will be provided on the above technical outlook in webinars held at 1030 GMT on Tuesday and Friday. If you are looking for ideas and feedback on how to improve your overall approach to trading, join me on Thursday each week for the Becoming a Better Trader webinar series.
Resources for Forex & CFD Traders
Whether you are a new or experienced trader, we have several resources available to help you; indicator for tracking trader sentiment, quarterly trading forecasts, analytical and educational webinars held daily, trading guides to help you improve trading performance, and one specifically for those who are new to forex.
---Written by Paul Robinson, Market Analyst
You can follow Paul on Twitter at @PaulRobinsonFX


