


Gold Price Forecast Overview:
- Gold prices remain within the descending channel from the September, but there are signs that the trend may be starting to change.
- Precious metals tend to outperform during periods of higher volatility as increased uncertainty enhances the safe haven appeal of gold and silver. Gold volatility is on pace for its largest one-day increase in three-weeks.
- Changes in retail trader positioning warn that gold prices may turn higher in the near-term.
Looking for longer-term forecasts on Gold and Silver prices? Check out the DailyFX Trading Guides.
Gold prices have turned higher at the start of the week after news broke that US President Donald Trump had convened with Federal Reserve Chair Jerome Powell and Treasury Secretary Steve Mnuchin during a previously unscheduled meeting. The surprise gathering took place in US President Trump’s personal quarters, not the West Wing, stirring speculation that the additional level of privacy meant there were other factors in play.
US-China Trade War Phase 1 Deal Uncertainty Helps Gold Prices
Of note, there have been news reports in recent days – which have been drowned out by the televised impeachment hearings and ongoing coverage of the protests in Hong Kong – that the US-China trade war Phase 1 deal may be on the verge of falling apart.
In this context, the meeting between US President Trump and Fed Chair Powell, and the ensuing comments thereafter, has led some (including this strategist) to believe that the Fed is being prepped to cushion the economy from the US-China trade war pre-2020 election. Bad news may be on the horizon regarding the US-China trade war Phase 1 deal.
Gold Prices Rebound with Higher Gold Volatility
While other asset classes don’t like increased volatility (signaling greater uncertainty around cash flows, dividends, coupon payments, etc.), precious metals tend to benefit during periods of higher volatility. Heightened uncertainty in financial markets due to increasing macroeconomic tensions (like US-China trade war or the prospect of a no-deal, hard Brexit, for example) increases the safe haven appeal of gold and silver.
GVZ (Gold Volatility) Technical Analysis: Daily Price Chart (November 2016 to November 2019) (Chart 1)
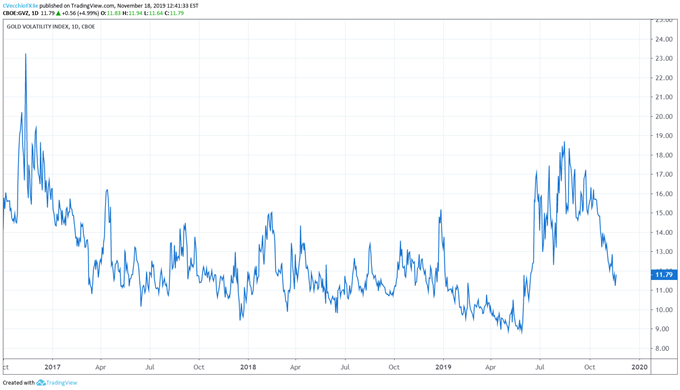
In the last gold price forecast update, it was noted that “there has been a noticeable decoupling [between gold prices and gold volatility] this week. In the past year, episodes where gold volatility has fallen but gold prices have not has been a ‘canary in the coal mine’ for a potential turn in price action.” There is evidence that a turn in gold price action is starting to take root.
Gold volatility (as measured by the Cboe’s gold volatility ETF, GVZ, which tracks the 1-month implied volatility of gold as derived from the GLD option chain) has rebounded to 11.79, its largest one-day increase since October 24.
Accordingly, the typical relationship between gold prices and gold volatility is starting to realign: the 5-day correlation between GVZ and gold prices is -0.22 while the 20-day correlation is 0.62; in the most recent update, the 5-day correlation was -0.63 and the 20-day correlation was 0.57.
Gold Price Technical Analysis: Daily Chart - Descending Channel (November 2018 to November 2019) (Chart 2)
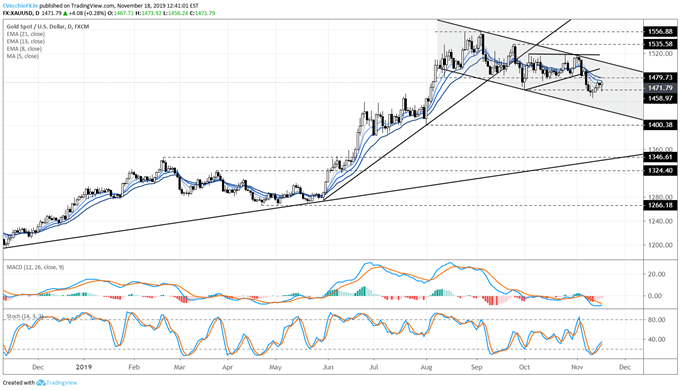
In our last gold price forecast technical analysis update, it was noted that “until the descending channel from the September and November highs breaks, it still holds that the path of least resistance is to the downside.” To this end, the downtrend from the September 4 and November 1 highs remains intact.
But gold prices continue to tread against the current, having traded back above the daily 5- and 8-EMAs, running into resistance at the daily 13-EMA today. Daily MACD is turning (albeit still in bearish territory), while Slow Stochastics have continued their advance out of oversold territory.
The bullish outside engulfing bar forming on the daily timeframe, assuming a close above 1471.29 (the high on November 15), bodes well for gold’s near-term prospects. If gold volatility continues to edge higher, it’s very possible that gold prices move above 1483, which would provoke an upgraded assessment.
Gold Price Technical Analysis: Weekly Chart – Inverse Head and Shoulders Pattern (February to October 2019) (Chart 3)
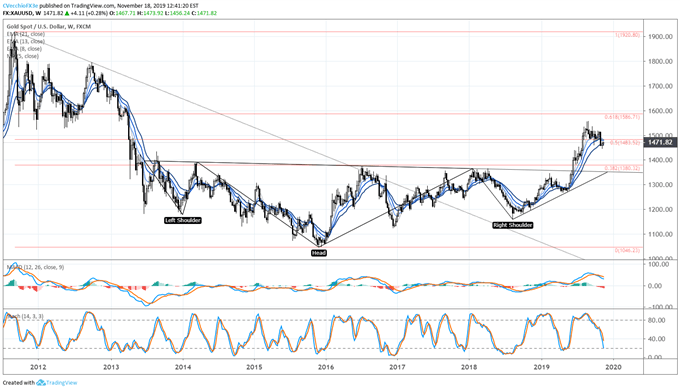
The weekly timeframe moves at a glacial pace, and thus there is no change since the last gold price forecast update. The gold price pullback since the October Fed meeting must be viewed in context of the longer-term technical picture: the gold price inverse head and shoulders pattern that originated earlier this year is still valid. Only a break below the August 1 bullish outside engulfing bar low at 1400.38 would draw into question the longer-term bullish potential.
Depending upon the placement of the neckline, the final upside targets in a potential long-term gold price rally vary: conservatively, drawing the neckline breakout against the January 2018 high at 1365.95 calls for a final target at 1685.67; aggressively, drawing the neckline breakout against the August 2013 high at 1433.61 calls for a final target at 1820.99.
IG Client Sentiment Index: Gold Price Forecast (November 18, 2019) (Chart 4)
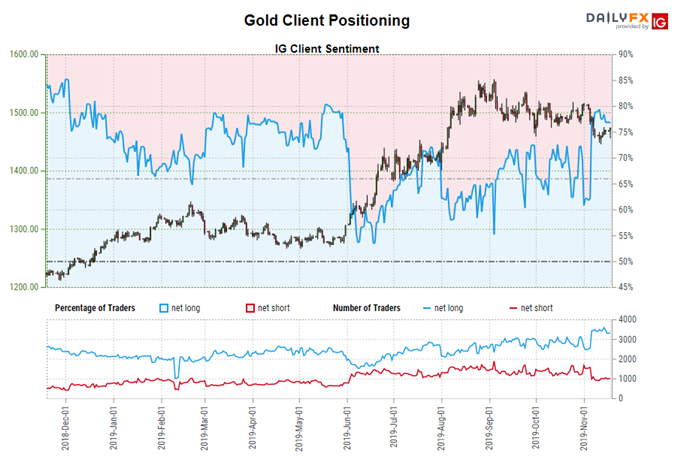
Gold: Retail trader data shows 74.65% of traders are net-long with the ratio of traders long to short at 2.94 to 1. The number of traders net-long is 1.88% lower than yesterday and 11.68% lower from last week, while the number of traders net-short is 10.81% higher than yesterday and 6.61% higher from last week.
We typically take a contrarian view to crowd sentiment, and the fact traders are net-long suggests Gold prices may continue to fall. Yet traders are less net-long than yesterday and compared with last week. Recent changes in sentiment warn that the current Gold price trend may soon reverse higher despite the fact traders remain net-long.
FX TRADING RESOURCES
Whether you are a new or experienced trader, DailyFX has multiple resources available to help you: an indicator for monitoring trader sentiment; quarterly trading forecasts; analytical and educational webinars held daily; trading guides to help you improve trading performance, and even one for those who are new to FX trading.
--- Written by Christopher Vecchio, CFA, Senior Currency Strategist
To contact Christopher Vecchio, e-mail at cvecchio@dailyfx.com
Follow him on Twitter at @CVecchioFX
View our long-term forecasts with the DailyFX Trading Guides


