


Gold Price Forecast Overview:
- Gold prices returned into their multi-week bull flag ahead of the October Fed meeting and haven’t left since. Now, gold prices have traded to their lowest level since early-August.
- Precious metals tend to underperform during periods of lower volatility as decreased uncertainty reduces the safe haven appeal of gold and silver. Gold volatility has recently moved to its lowest level since late-July.
- Changes in retail trader positioning gives us a bearish gold price trading bias at the start of the trading week.
Looking for longer-term forecasts on Gold and Silver prices? Check out the DailyFX Trading Guides.
Gold prices have taken a beating in November so far. With Federal Reserve interest rate cut odds receding thanks to perceived progress on the US-China trade war front, one of the primary reasons for holding precious metals – an environment defined by falling real yields – has since been snuffed out. As global bond yields, but most notably, US Treasury yields rise, market participants have less of a reason to stay long gold on a risk-adjusted basis. It matters little that the Fed doesn’t plan on raising rates any time soon if the environment is defined by one in which rate cut odds are continuing to pull back.
Gold Prices Following Gold Volatility Lower
While other asset classes don’t like increased volatility (signaling greater uncertainty around cash flows, dividends, coupon payments, etc.), precious metals tend to benefit during periods of higher volatility. Heightened uncertainty in financial markets due to increasing macroeconomic tensions (like US-China trade war or the prospect of a no-deal, hard Brexit, for example) increases the safe haven appeal of gold and silver. On the other hand, when uncertainty decreases, volatility tends to fall, reducing the demand for safety assets. Such is the case at the moment for gold prices.
GVZ (Gold Volatility) Technical Analysis: Daily Price Chart (November 2016 to November 2019) (Chart 1)

Gold volatility (as measured by the Cboe’s gold volatility ETF, GVZ, which tracks the 1-month implied volatility of gold as derived from the GLD option chain) has fallen to its lowest level since the end of July, currently trading at 12.83, just off of its lowest level since the end of July 2019. Gold prices have followed lower, recently trading to their weakest point snice the first week of August.
Recent price action has been messy, however, and as a result, the typical relationship between gold prices and gold volatility is weaker than usual: the 5-day correlation between GVZ and gold prices is -0.62 while the 20-day correlation is 0.15; a function of the fact that gold volatility is up marginally on balance the past three days while god prices have fallen.
Gold Price Technical Analysis: Daily Chart - Descending Channel (November 2018 to November 2019) (Chart 2)
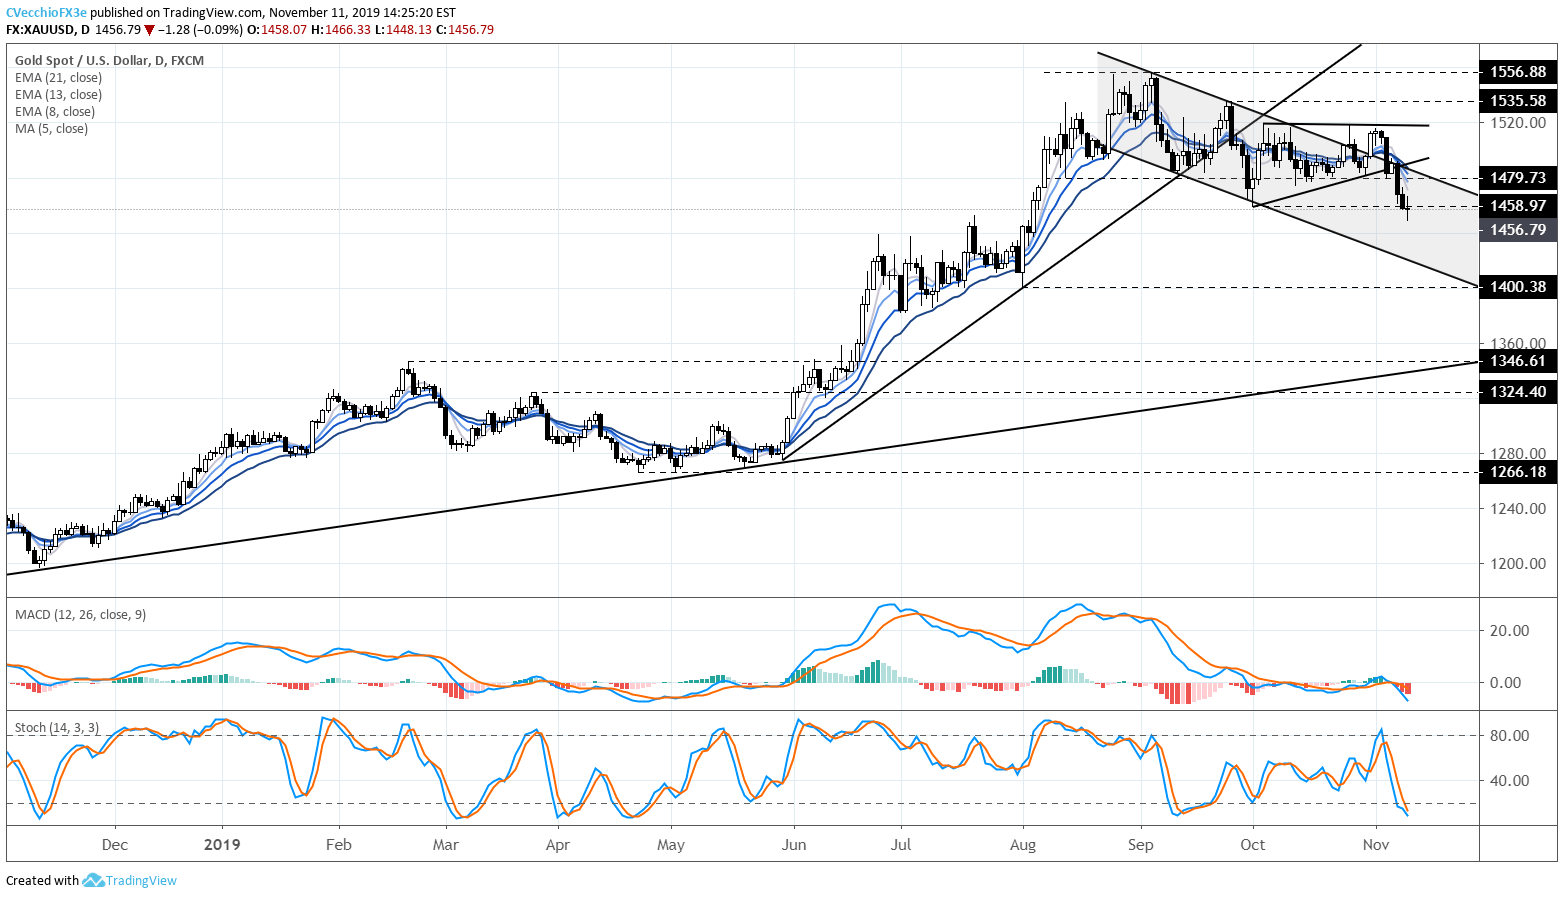
In our last gold price forecast technical analysis update, it was noted that there “is more evidence that a false breakout may be transpiring. A sustained move back into the bull flag now sees gold prices testing the intra-month uptrend off the October 1 and October 22 swing lows; a break below the October 22 low at 1480.73 may signal the start of a deeper pullback.”
Indeed, the bear case for the gold price outlook has bore out, with gold prices trading below the October 1 low at 1458.97, sitting at 1456.79 at the time of writing. Bearish momentum has accelerated in recent days – particularly since the October Fed meeting – with the current spot gold price comfortably below the daily 5-, 8-, 13-, and 21-EMA envelope, which is in bearish sequential order. Slow Stochastics have plunged into oversold territory, while daily MACD is trending lower in bearish territory.
The path of least resistance is to the downside; support in the descending channel does not come into play until closer to 1400 through the end of November – a key area for the weekly timeframe and the longer-term inverted head and shoulders pattern (more on that below). Only a move above 1483 this week would provoke a reconsideration of the short-term bearish bias for gold prices.
Gold Price Technical Analysis: Weekly Chart – Inverse Head and Shoulders Pattern (February to October 2019) (Chart 3)

The recent run of weakness in gold prices has started to weaken the longer-term bullish technical perspective for gold prices now that the weekly 21-EMA is under pressure. Still, the gold price pullback since the October Fed meeting must be viewed in context of the longer-term technical picture: the gold price inverse head and shoulders pattern that originated earlier this year is still valid. Only a break below the August 1 bullish outside engulfing bar low at 1400.38 would draw into question the longer-term bullish potential.
Depending upon the placement of the neckline, the final upside targets in a potential long-term gold price rally vary: conservatively, drawing the neckline breakout against the January 2018 high at 1365.95 calls for a final target at 1685.67; aggressively, drawing the neckline breakout against the August 2013 high at 1433.61 calls for a final target at 1820.99.
IG Client Sentiment Index: Gold Price Forecast (November 11, 2019) (Chart 4)
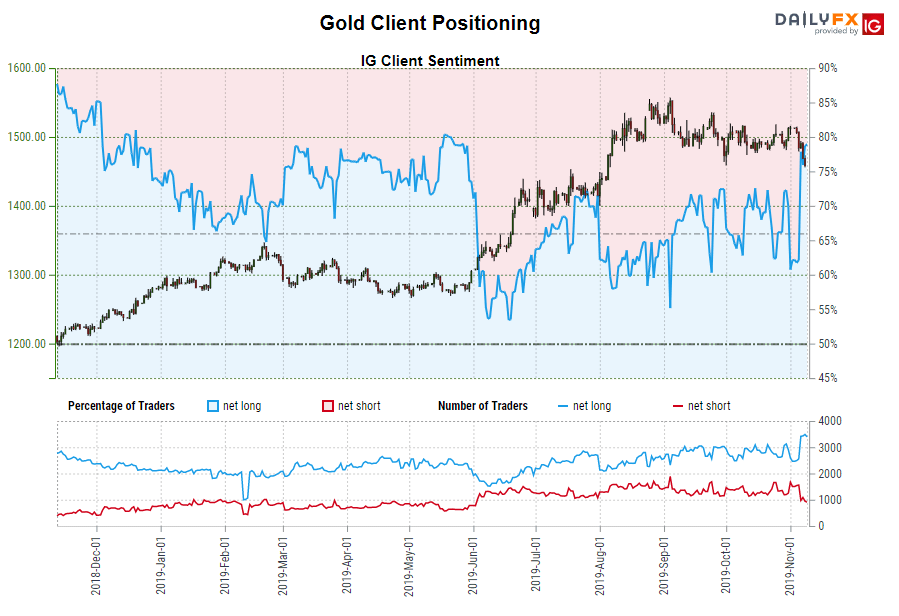
Gold: Retail trader data shows 78.92% of traders are net-long with the ratio of traders long to short at 3.74 to 1. The number of traders net-long is 0.82% lower than yesterday and 37.61% higher from last week, while the number of traders net-short is 3.92% lower than yesterday and 39.76% lower from last week.
We typically take a contrarian view to crowd sentiment, and the fact traders are net-long suggests Gold prices may continue to fall. Traders are further net-long than yesterday and last week, and the combination of current sentiment and recent changes gives us a stronger Gold-bearish contrarian trading bias.
FX TRADING RESOURCES
Whether you are a new or experienced trader, DailyFX has multiple resources available to help you: an indicator for monitoring trader sentiment; quarterly trading forecasts; analytical and educational webinars held daily; trading guides to help you improve trading performance, and even one for those who are new to FX trading.
--- Written by Christopher Vecchio, CFA, Senior Currency Strategist
To contact Christopher Vecchio, e-mail at cvecchio@dailyfx.com
Follow him on Twitter at @CVecchioFX
View our long-term forecasts with the DailyFX Trading Guides


