


XAU/USD Price Outlook
- Gold price chart and analysis.
- XAU/USD price action.
Check our Q4 forecasts for EUR, USD, Oil and find out for free what might move the price this quarter.
Gold Prices – Downside Swing
At the start of the week, Gold changed course then cancelled bullish signals discussed in our last update. Yesterday, the price pressed lower and printed $1,460 – its lowest price in over five weeks.
Alongside this, the Relative Strength Index (RSI) crossed below 50 then dropped to 37 highlighting seller’s domination.
Having trouble with your trading strategy? Here’s the #1 Mistake That Traders Make
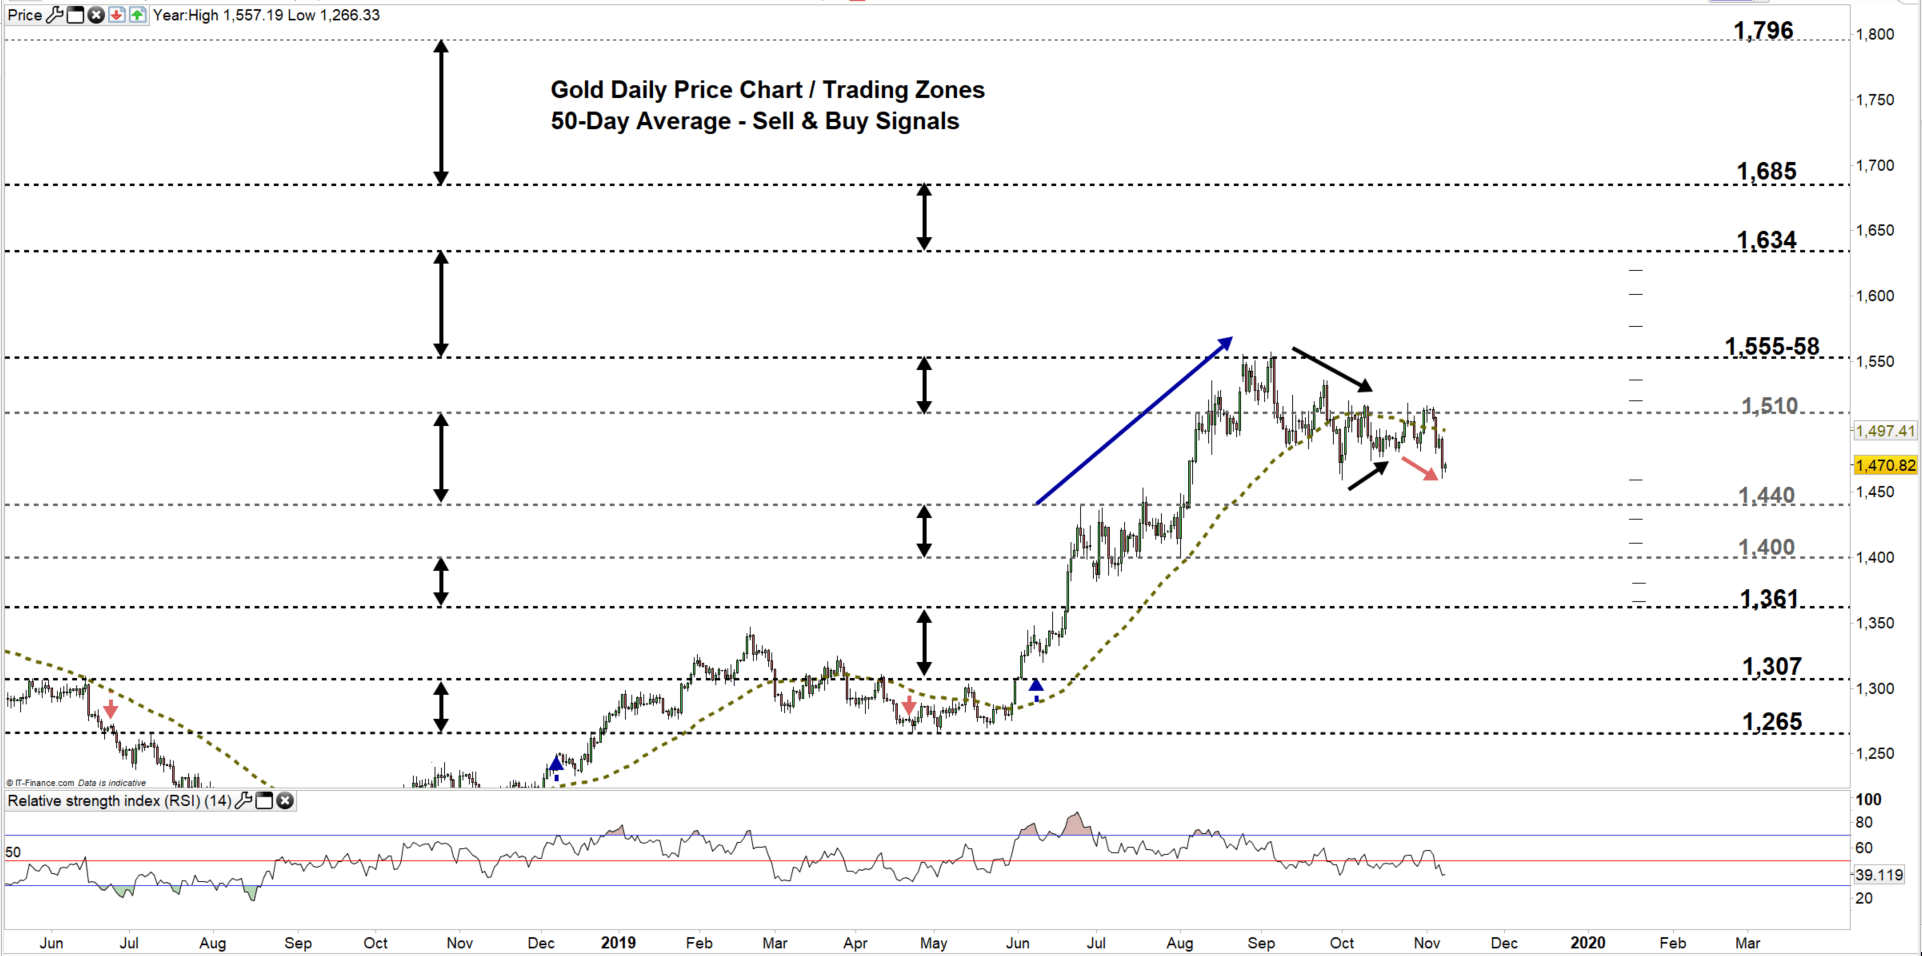
Gold DAILY PRICE CHART (May 18, 2018 – Nov 8, 2019) Zoomed out
Gold DAILY PRICE CHART (20 JUne – Nov 8, 2019) Zoomed In
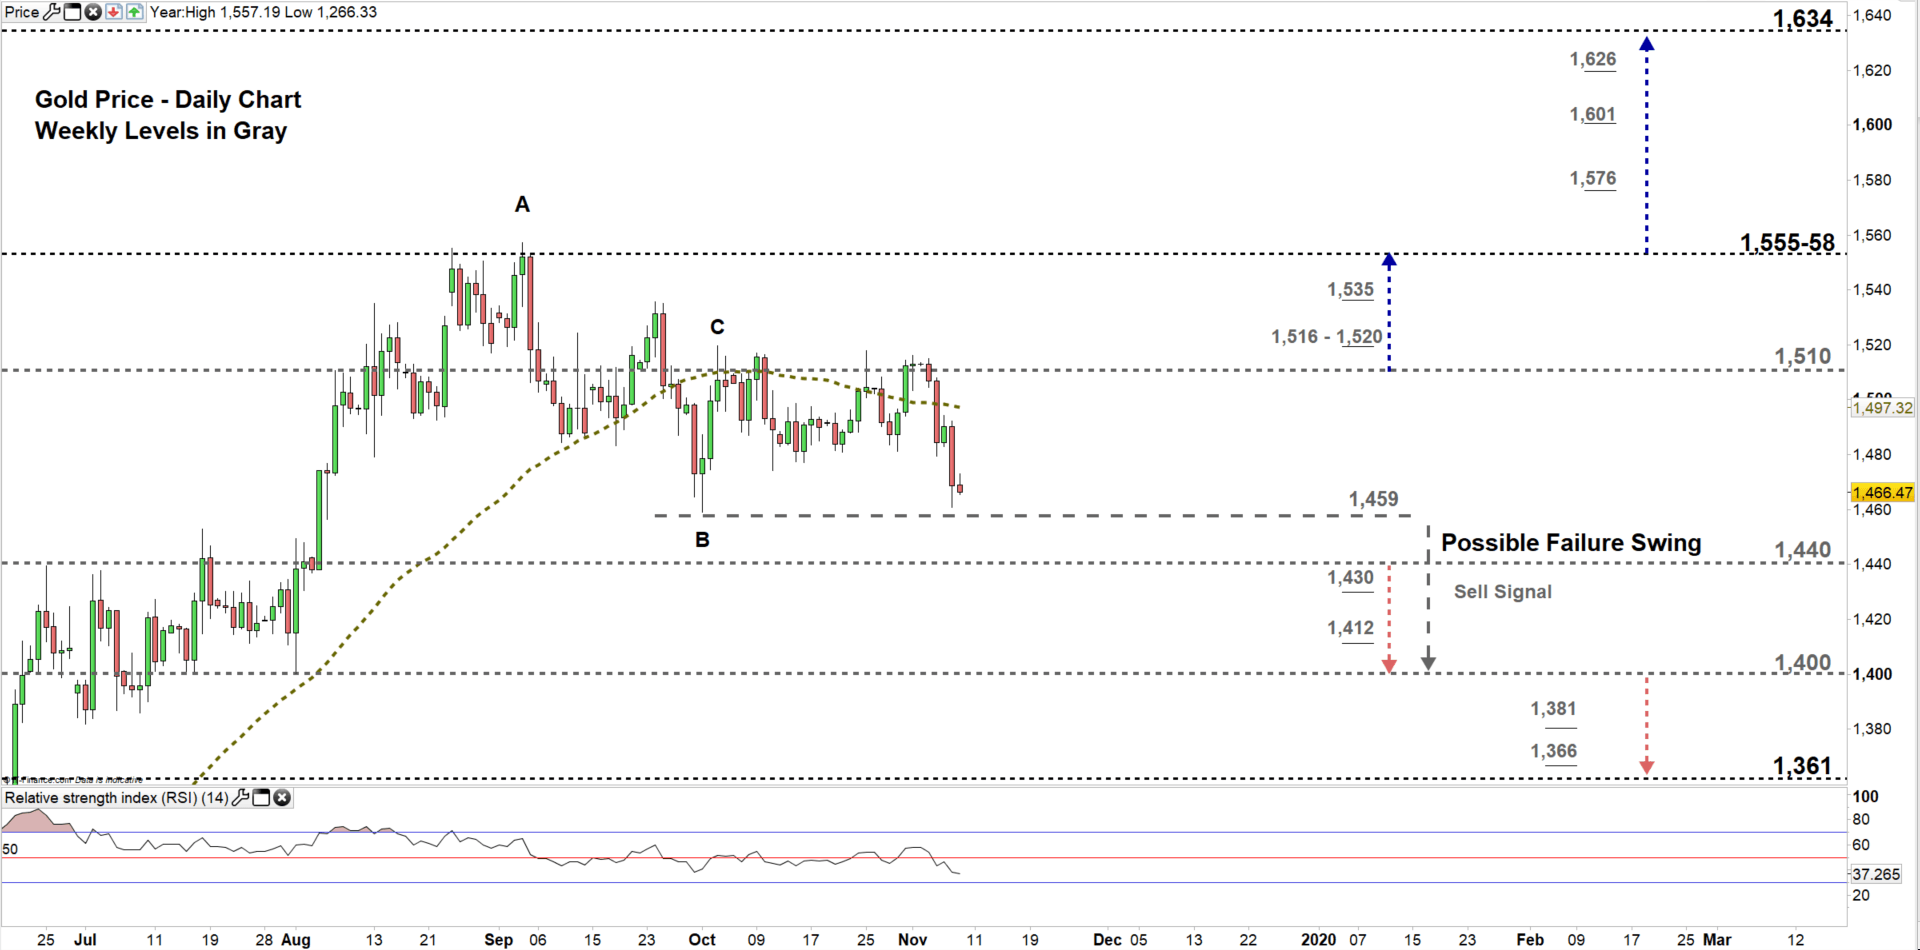
Looking at the daily chart, we notice a possible failure swing. The failure of peak at C to overcome A. Any violation of the low B at $1,459 constitutes a sell signal.
On Monday, XAU/USD declined to the lower trading zone $1,440 - $1,510. Later, price has pressed lower eyeing a test of the low end of the zone. Thus, a close below the low end could be an additional sell signal, hinting to press towards $1,400 handle. Although, the weekly support levels underlined on the chart (zoomed in) should be considered.
On the other hand, a close above the other side of the trading zone, i.e. above the high end could increase the likelihood of rallying towards the vicinity of $1,555-58. Nevertheless, the weekly resistance area and level marked on the chart should be watched closely.
See the chart, to know more about the lower trading zone with support levels price would encounter in a further bearish scenario.
Just getting started? See our Beginners’ Guide for FX traders
Gold Four-HOUR PRICE CHART (Oct 3 – Nov 8, 2019)
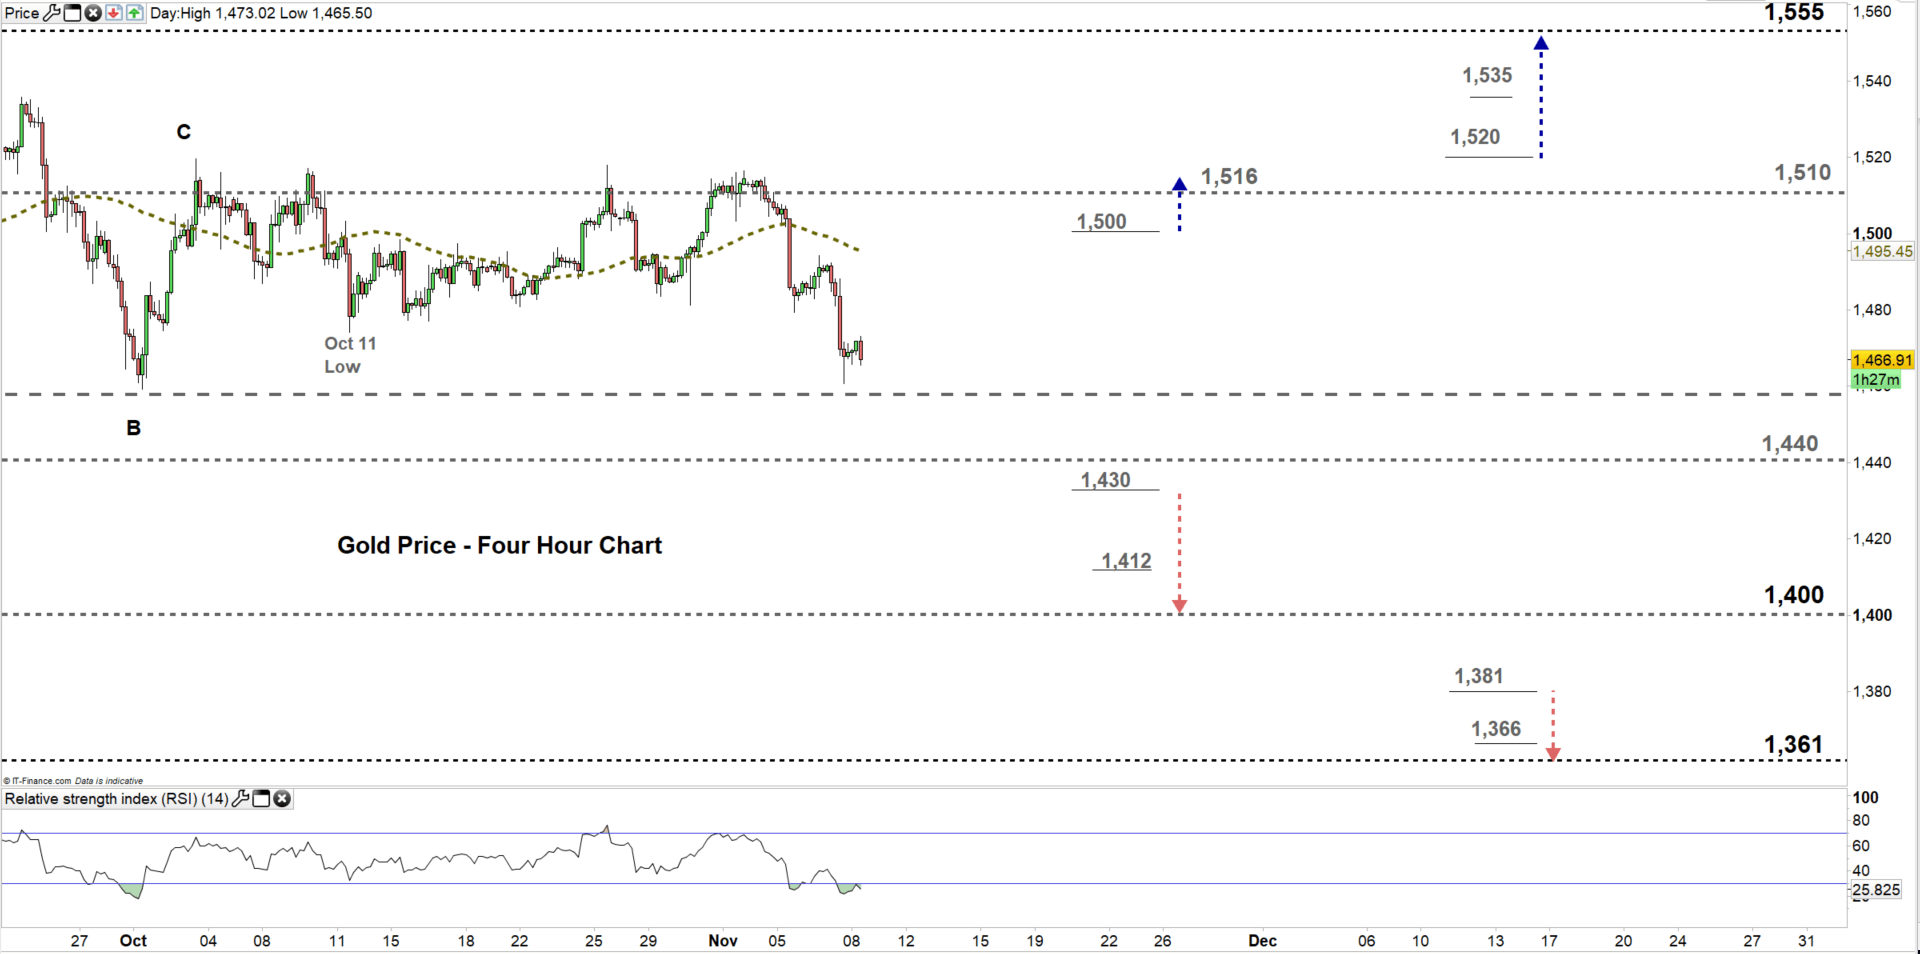
From the four-hour chart, we notice yesterday Gold broke below Oct 11 low at $1,474, then started a fresh downtrend move creating a lower low at $1,460.
Considering the selling signals discussed above on the daily chart. A break below $1,430 could send the price towards $1,400 handle. However, the weekly resistance level marked on the chart should be monitored. That said, a break above $1,500 handle could cause a rally towards $1,516. In that scenario, the high end of current trading zone at $1,510 needs to be kept in focus.
See the chart to know more about key technical levels in a further bullish/bearish scenario.
Written By: Mahmoud Alkudsi
Please feel free to contact me on Twitter: @Malkudsi


