


Gold Price Forecast Overview:
- Uncertainty over the next steps in the Brexit process may be provoking uneasiness for traders of the British Pound, but not enough to spark a rally by gold prices.
- Precious metals tend to underperform during periods of lower volatility as decreased uncertainty reduces the safe haven appeal of gold and silver. To this end, the 5-day correlation between GVZ and gold prices is 0.82, and the 20-day correlation is 0.42.
- Changes in retail trader positioning gives us a bearish spotgold trading bias.
Looking for longer-term forecasts on Gold and Silver prices? Check out the DailyFX Trading Guides.
Uncertainty over the next steps in the Brexit process may be provoking uneasiness for traders of the British Pound, but otherwise, all is quiet on the western front. US equity markets continue to run higher amid a weaker US Dollar, thanks in part to perceived progress in the US-China trade war talks. Any efforts made to reduce friction between the world’s two largest economies likely reduces the need for G10 currencies’ central banks to deliver significantly lower interest rates in the near-term.
Gold Prices Boosted by Rising Gold Volatility
While other asset classes don’t like increased volatility (signaling greater uncertainty around cash flows, dividends, coupon payments, etc.), precious metals tend to benefit during periods of higher volatility. Heightened uncertainty in financial markets due to increasing macroeconomic tensions (like US-China trade war or the prospect of a no-deal, hard Brexit, for example) increases the safe haven appeal of gold and silver.
GVZ (Gold Volatility) Technical Analysis: Daily Price Chart (November 2016 to October 2019) (Chart 1)
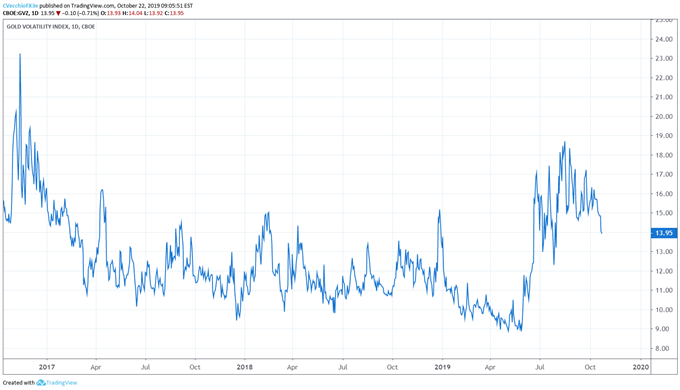
Gold volatility (as measured by the Cboe’s gold volatility ETF, GVZ, which tracks the 1-month implied volatility of gold as derived from the GLD option chain) has broken to its lowest level since the end of July, currently trading at 13.95. However, despite the plunge in gold volatility, gold prices have not followed. The 5-day correlation between GVZ and gold prices is 0.82, and the 20-day correlation is 0.42; four weeks ago, on September 24, the 5-day correlation was 0.97 and the 20-day correlation was 0.86.
Gold Price Technical Analysis: Daily Chart - Bull Flag/Descending Channel (October 2018 to October 2019) (Chart 2)
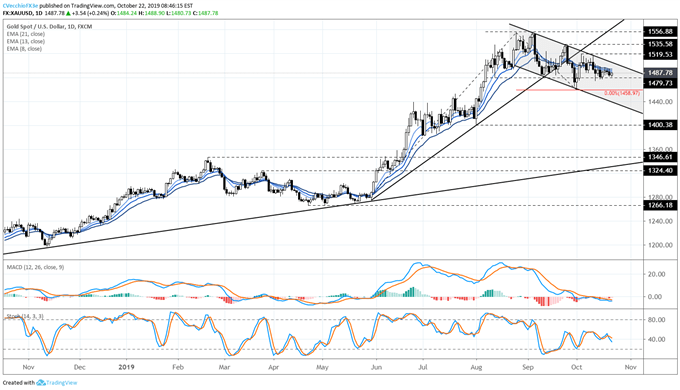
As far as significant price movements go, traders will need to look elsewhere. In the past week since our last gold price forecast update, prices have continued to trade sideways. It still holds that neither the October low (set on October 1 at 1458.97) nor the October high (set on October 3 at 1519.53) have been tested since the first week of the month.
In a sense, nothing has changed for gold’s momentum profile. “While the gold price bull flag continues to be the predominant price pattern monitored at present time, it is worth noting that momentum is starting to turn lower within the descending channel. Gold prices are below the daily 8-, 13-, and 21-EMA envelope, which are aligned in bearish sequential order. Daily MACD is slipping below its signal line, while Slow Stochastics have dropped back into bearish territory.”
Accordingly, the descending channel/bull flag support comes into play near 1435 by the end of the week, so a sharp turn lower may still not be the sign of a top. It still holds that, “if the bull flag in gold prices is legitimate, a break above the late-September swing high at 1538.58 would need to be achieved. In doing so, gold prices would also retake the uptrend from the May and August 2019 lows. The 100% extension of the move from the May low, the September high, and the October low calls for a target price of 1726.31.”
Gold Price Technical Analysis: Weekly Chart – Inverse Head and Shoulders Pattern (February to October 2019) (Chart 3)
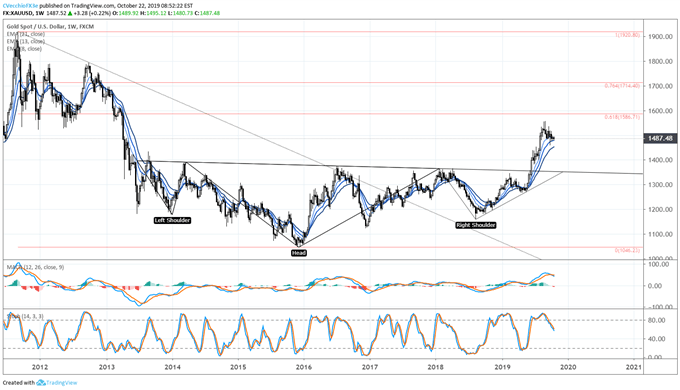
Recent gold price consolidation on the daily timeframe must be viewed in context of the longer-term technical picture: the gold price inverse head and shoulders pattern that originated earlier this year is still valid. Depending upon the placement of the neckline, the final upside targets in a potential long-term gold price rally vary: conservatively, drawing the neckline breakout against the January 2018 high at 1365.95 calls for a final target at 1685.67; aggressively, drawing the neckline breakout against the August 2013 high at 1433.61 calls for a final target at 1820.99. Only a break below the August 1 bullish outside engulfing bar low at 1400.38 would draw into question the longer-term bullish potential.
IG Client Sentiment Index: Spot Gold Price Forecast (October 22, 2019) (Chart 4)
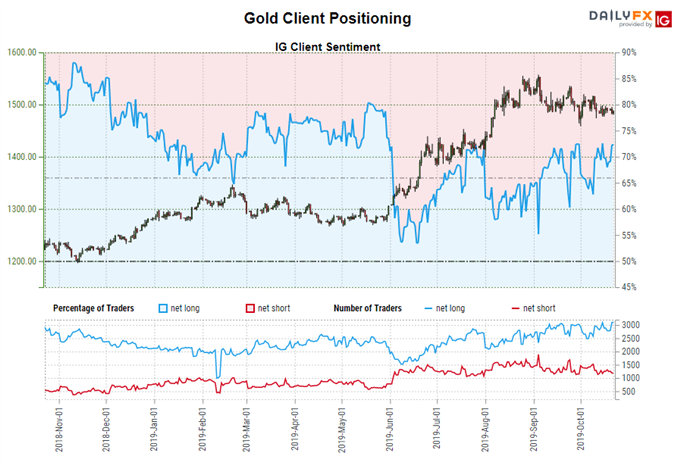
Spot gold: Retail trader data shows 69.1% of traders are net-long with the ratio of traders long to short at 2.23 to 1. The number of traders net-long is 0.7% higher than yesterday and 5.4% lower from last week, while the number of traders net-short is 11.0% lower than yesterday and 5.0% higher from last week.
We typically take a contrarian view to crowd sentiment, and the fact traders are net-long suggests spot gold prices may continue to fall. Traders are further net-long than yesterday and last week, and the combination of current sentiment and recent changes gives us a stronger spot gold-bearish contrarian trading bias.
FX TRADING RESOURCES
Whether you are a new or experienced trader, DailyFX has multiple resources available to help you: an indicator for monitoring trader sentiment; quarterly trading forecasts; analytical and educational webinars held daily; trading guides to help you improve trading performance, and even one for those who are new to FX trading.
--- Written by Christopher Vecchio, CFA, Senior Currency Strategist
To contact Christopher Vecchio, e-mail at cvecchio@dailyfx.com
Follow him on Twitter at @CVecchioFX
View our long-term forecasts with the DailyFX Trading Guides


