


- Gold prices coiling just above uptrend support- breakout of contractionary range in focus
- Check out our 2019 projections in our Free DailyFX Gold Trading Forecasts
- Join Michael for Live Weekly Strategy Webinars on Mondays at 12:30GMT
Gold prices crept higher this week with the precious metal rallying 0.25% to trade at 1490 ahead of the New York close on Friday. Price has continued to contract just above longer-term uptrend support and we’re looking for the break to offer guidance on our near-term directional bias. These are the updated targets and invalidation levels that matter on the XAU/USD charts this week. Review my latestWeekly Strategy Webinar for an in-depth breakdown of this setup and more.
New to Gold Trading? Get started with this Free How to Trade Gold -Beginners Guide
Gold Price Chart - XAU/USD Weekly
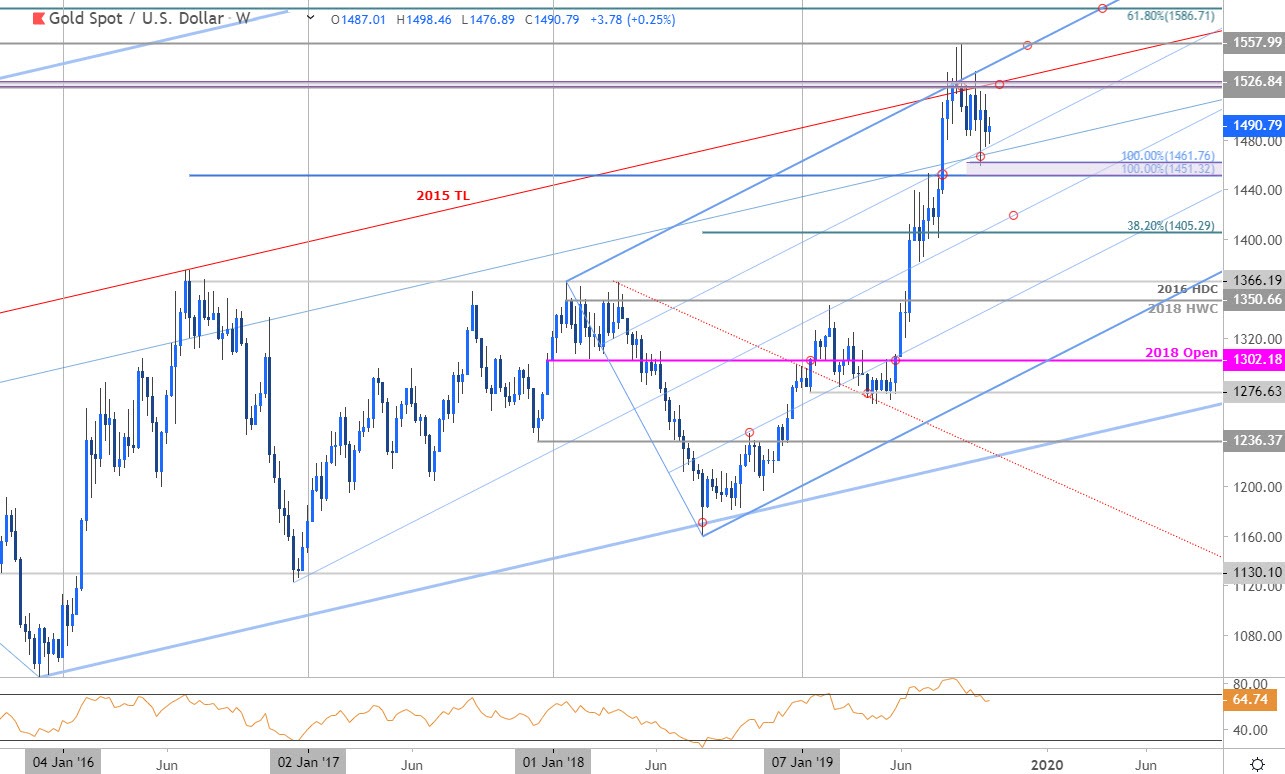
Chart Prepared by Michael Boutros, Technical Strategist; Gold on Tradingview
Notes: In my last Gold Weekly Price Outlook we noted that, “prices remain vulnerable after reversing off long-term trend resistance. From at trading standpoint, the risk remains for a deeper pullback towards uptrend support.” XAU/USD registered a low at 1473 in the following days but continues to coil here just above the 75% parallel of the broader ascending pitchfork formation we’ve been tracking off the 2016 / 2018 lows.
A break below this parallel would once again look to challenge key support at 1451/61- a region defined by the 100% extensions of the ascent off the 2016 lows and decline off the yearly highs. A close below this threshold would be needed to suggest that a larger gold correction is underway with such a scenario risking a test of median-line support, currently near 1420s. Critical resistance steady at 1522/26- a breach / close above is needed to mark resumption targeting 1557 and the 61.8% retracement at 1586.
For a complete breakdown of Michael’s trading strategy, review his Foundations of Technical Analysis series on Building a Trading Strategy
Bottom line: Gold prices are coiling just above longer-term slope support – taking a more neutral stance here while noting the risk for a deeper pullback while below 1522/26. Form a trading standpoint, be on the lookout for a breakout of the monthly consolidation / topside exhaustion ahead of the monthly high-day close at 1505on rebounds IF price is indeed heading lower. A break below the October open at 1472 is ultimatelyneeded to challenge the monthly lows / key support at 1451/61. Review my latest Gold Price Outlook for a closer look at the near-term XAU/USD technical trading levels.
Gold Trader Sentiment – XAU/USD Price Chart
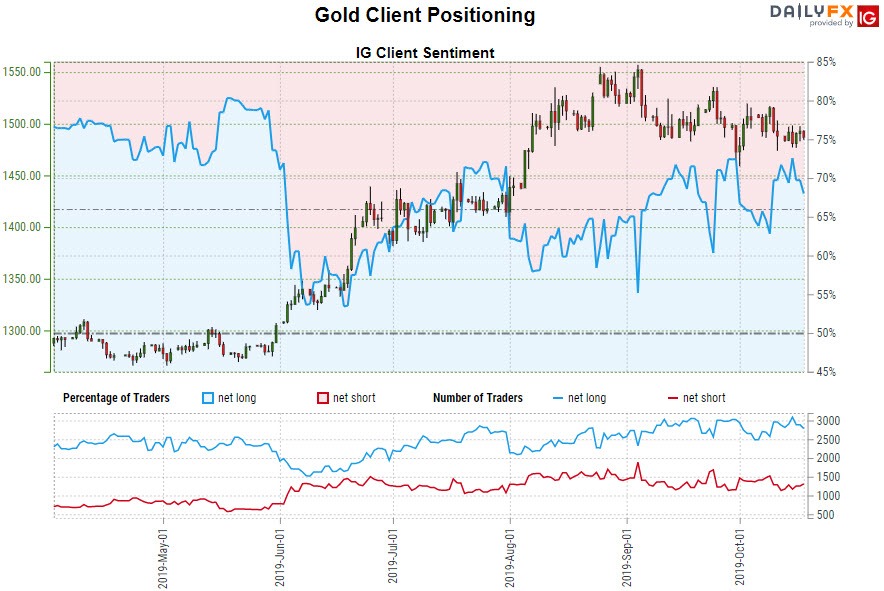
- A summary of IG Client Sentiment shows traders are net-long Gold- the ratio stands at +2.31 (69.77% of traders are long) – bearishreading
- Long positions are1.76% higher than yesterday and 3.01% higher from last week
- Short positions are3.26% lower than yesterday and 6.17% lower from last week
- We typically take a contrarian view to crowd sentiment, and the fact traders are net-long suggests Gold prices may continue to fall. Traders are further net-long than yesterday and last week, and the combination of current sentiment and recent changes gives us a stronger Gold-bearish contrarian trading bias from a sentiment standpoint.
See how shifts in Gold retail positioning are impacting trend- Learn more about sentiment!
---
Previous Weekly Technical Charts
- Euro (EUR/USD)
- US Dollar (DXY)
- New Zealand Dollar (NZD/USD)
- Canadian Dollar (USD/CAD)
- Sterling (GBP/USD)
- Silver (XAG/USD)
- Crude Oil (WTI)
Learn how to Trade with Confidence in our Free Trading Guide
--- Written by Michael Boutros, Technical Currency Strategist with DailyFX
Follow Michael on Twitter @MBForex


