


- Gold prices holding near-term downtrend formation– risk remains while below1522/26
- Check out our 2019 projections in our Free DailyFX Gold Trading Forecasts
- Join Michael for Live Weekly Strategy Webinars on Mondays at 12:30GMT
Gold prices are in consolidation with the recent price rally still at risk while below near-term downtrend resistance. These are the updated targets and invalidation levels that matter on the XAU/USD charts this week. Review my latestWeekly Strategy Webinar for an in-depth breakdown of this Euro price setup and more.
New to Gold Trading? Get started with this Free How to Trade Gold -Beginners Guide
Gold Price Chart - XAU/USD Daily

Chart Prepared by Michael Boutros, Technical Strategist; Gold on Tradingview
Technical Outlook: In my latest Gold Price Outlook we noted that XAU/USD was approaching a key resistance pivot and, “the risk remains for a deeper correction here while below this level.” The threshold in focus remains the 1522/26 confluence zone where the late-2011 & 2012 lows converge on the monthly open. Look for a reaction into this region IF reached with the broader advance vulnerable while below. Key daily support steady at the August swing-low / 50% retracement at 1479/80 – a break / close below is needed to suggest a more significant high was registered this month.
Gold Price Chart - XAU/USD 120min

Notes: A closer look at gold price action shows XAU/USD trading within the confines of a well-defined descending pitchfork formation we’ve been tracking off August / September highs. Price has carved out an embedded near-term consolidation formation after rebounding off the lower parallel last week.
Initial resistance stands at 1511 backed by the highlighted trendline confluence around 1520- critical resistance / bearish invalidation steady at 1526. Initial support rests at 149/97 with a break below the weekly open at 1488 needed to mark resumption of the near-term downtrend targeting 1479 and the 61.8% retracement at 1460.
Why does the average trader lose? Avoid these Mistakes in your trading
Bottom line: The risk remains for further losses while within this formation with a break below weekly open support needed to fuel the next leg lower in price. From at trading standpoint, we’ll favor fading strength sub-1520. Ultimately a larger correction would offer more favorable long-entries closer to broader trend support. Review my latest Gold Price Weekly Outlook for a closer look at the longer-term XAU/USD technical trading levels.
For a complete breakdown of Michael’s trading strategy, review his Foundations of Technical Analysis series on Building a Trading Strategy
Gold Trader Sentiment - XAU/USD Price Chart
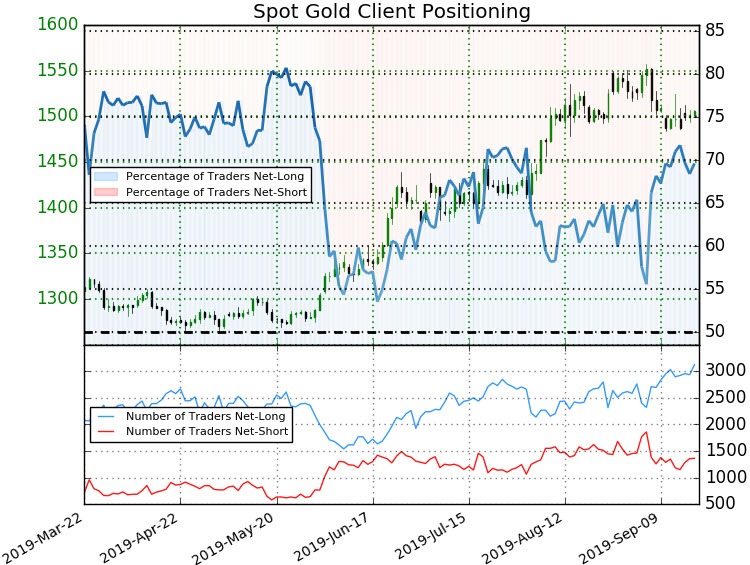
- A summary of IG Client Sentiment shows traders are net-long Gold- the ratio stands at +2.29 (69.6% of traders are long) – bearishreading
- Long positions are 2.3% higher than yesterday and 1.5% higher from last week
- Short positions are1.6% higher than yesterday and 3.4% higher from last week
- We typically take a contrarian view to crowd sentiment, and the fact traders are net-long suggests Spot Gold prices may continue to fall. Traders are further net-long than yesterday and last week, and the combination of current positioning and recent changes gives us a stronger Spot Gold-bearish contrarian trading bias from a sentiment standpoint.
See how shifts in Gold retail positioning are impacting trend- Learn more about sentiment!
---
Active Trade Setups
- Canadian Dollar Price Outlook: USD/CAD Rally at Resistance into FOMC
- Australian Dollar Price Outlook: Aussie Breakout Potential into FOMC
- Euro Price Outlook: EUR/USD Breakout Targets- Battle Lines Drawn
- Swiss Franc Price Outlook: USD/CHF Rally Grinds into Trend Resistance
- Near-term Trade Setups in USD/CAD, GBP/USD & USD/CHF
- Sterling Price Outlook: British Pound Rally Stalls– GBP/USD Levels
- Written by Michael Boutros, Currency Strategist with DailyFX
Follow Michael on Twitter @MBForex


