


Silver Price Forecast Overview
- Silver prices, like their golden counterpart, are benefitting from an environment marked by rising tensions in the US-China trade war. It still holds that, because silver prices are spending more and more time above the downtrend from the 2014 and 2016 highs, a long-term bottoming effort is taking shape.
- The daily doji candle established on Tuesday, August 13 has yet to see either its higher or low breached; a break above near-term resistance at 17.489 would signal a bullish continuation effort to 18.468.
- Recent changes in sentiment warn that the current spot silver price trend may soon reverse higher despite the fact traders remain net-long.
Looking for longer-term forecasts on Gold and Silver prices? Check out the DailyFX Trading Guides.
The Federal Reserve’s Jackson Hole Economic Policy Symposium hasn’t produced much by way of a direct impact on financial markets; Fed Chair Jerome Powell’s speech was neither a relieving or repressing factor, as was widely expected heading into today.
But with US President Donald Trump’s aggressive tweets in response to not only Fed Chair Powell but China’s surprise announcement for 5% to 10% tariffs on $75 billion of imported US goods starting September 1 and December 15, the period of détente in the US-China trade war appears to be over. Another drop by US Treasury yields coupled with a bump in Fed rate cut expectations is proving a potent mix for precious metals, including silver prices.
Silver Volatility Hits Highest Level Since January 2017
While other asset classes don’t like increased volatility (signaling greater uncertainty around cash flows, dividends, coupon payments, etc.), precious metals tend to benefit from periods of higher volatility as uncertainty increases gold’s and silver’s safe haven appeal.
VXSLV (SILVER VOLATILITY) TECHNICAL ANALYSIS: DAILY PRICE CHART (NOVEMBER 2016 TO AUGUST 2019) (CHART 1)
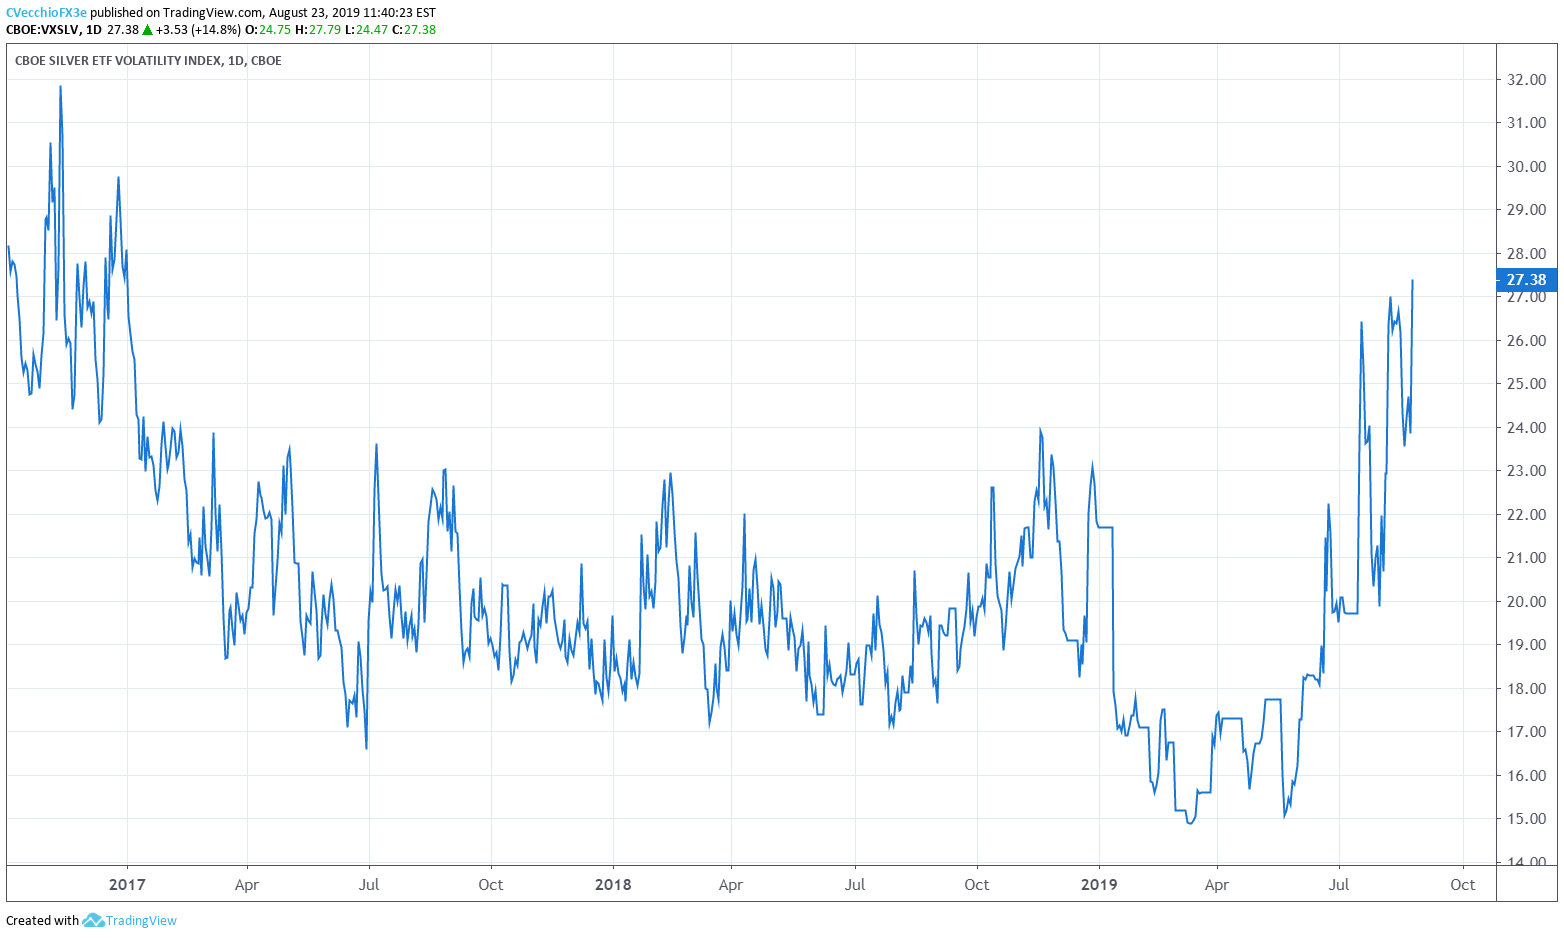
Silver volatility (as measured by the Cboe’s gold volatility ETF, VXSLV, which tracks the 1-month implied volatility of gold as derived from the SLV option chain) is running higher around the latest US-China trade war developments. VXSLV is currently trading at 27.38, its highest level since January 3, 2017. To this end, now that VXSLV has pushed to a fresh yearly high, it is likely that silver prices soon follow: the 5-day correlation between VXSLV and silver prices is 0.91 and the 20-day correlation is 0.86.
SILVER PRICE TECHNICAL ANALYSIS: WEEKLY CHART (AUGUST 2013 TO AUGUST 2019) (CHART 2)
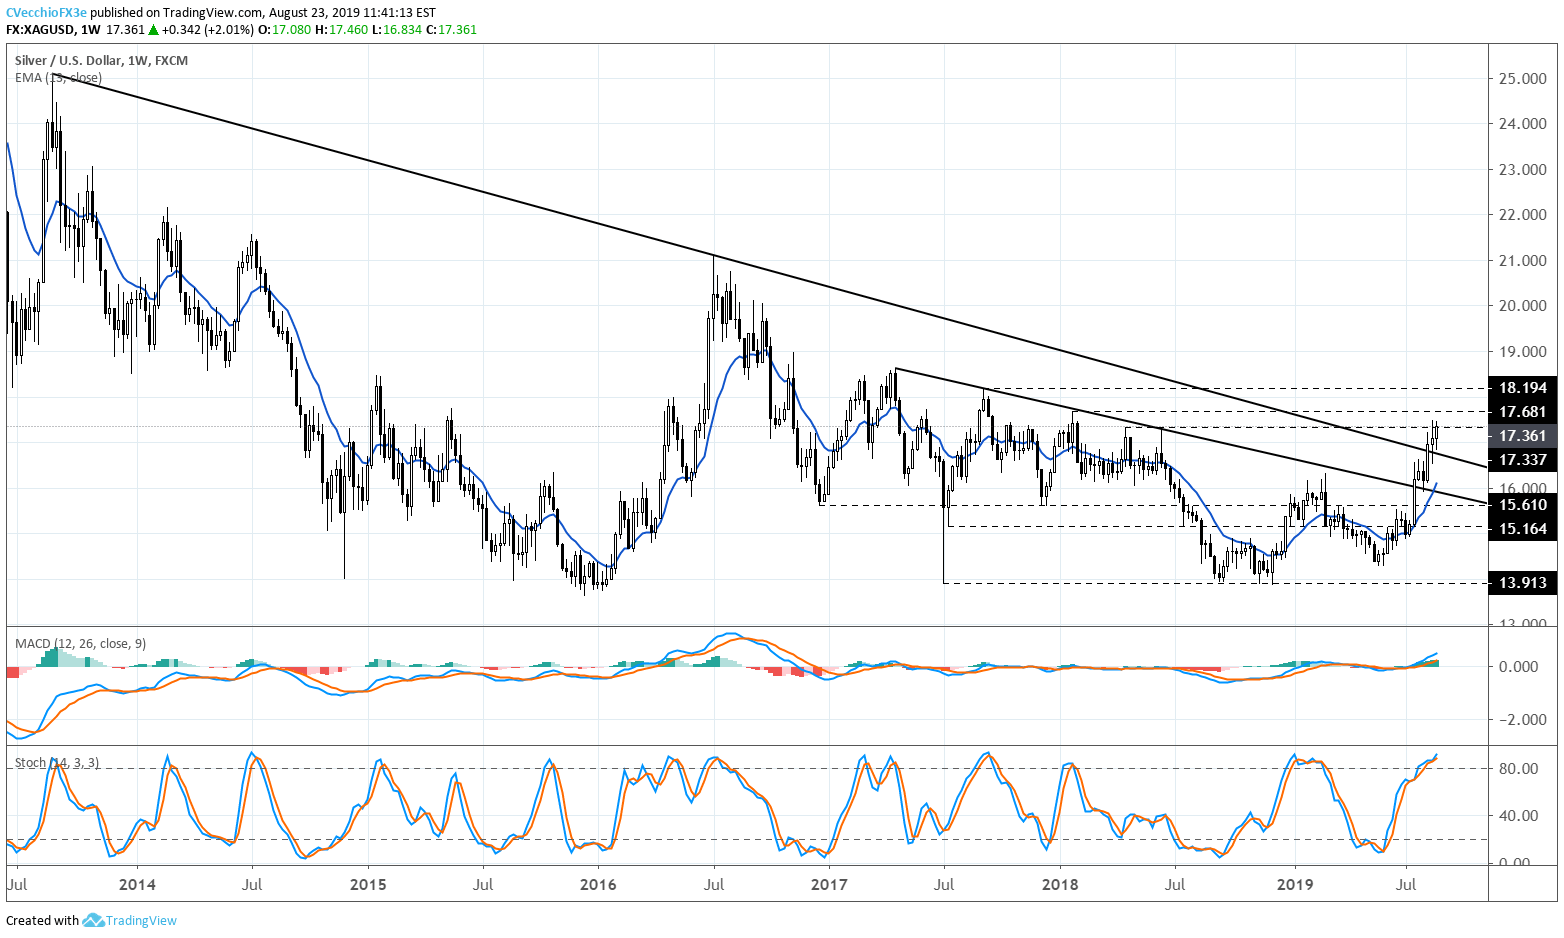
Like gold prices, which are eyeing a bullish continuation effort, silver prices are eyeing a continuation of the bottoming effort that’s been gathering pace in recent weeks. The move above the April and September 2017 and the June 2018 swing highs, as well as the 2013 and 2016 swing highs, has been maintained. Efforts lasts week to return into the downtrend failed; silver prices have warded off a false breakout attempt. It still holds, as was noted last week, that the efforts by silver prices to establish a long-term bottom are gaining more and more legitimacy.
SILVER PRICE TECHNICAL ANALYSIS: DAILY CHART (DECEMBER 2017 TO AUGUST 2019) (CHART 3)
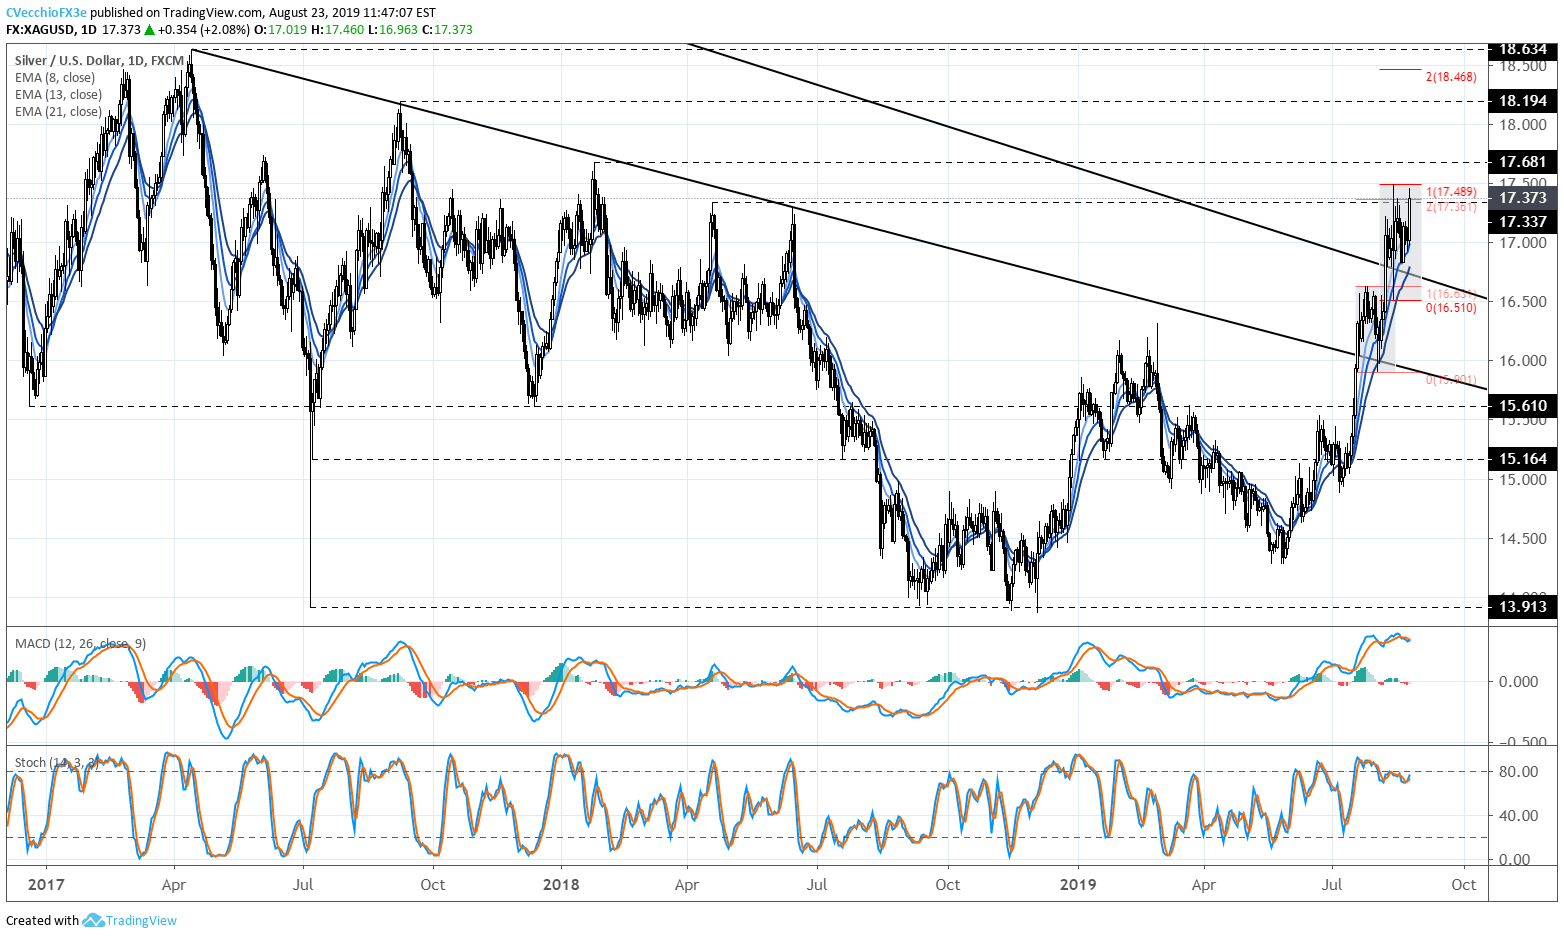
For now, the doji candle established on Tuesday, August 13 has yet to see either its higher or low breached; 16.510 is near-term support while 17.489 is near-term resistance. A move through the doji high would also produce a breach of the April and June 2018 near 17.337.
SILVER PRICE TECHNICAL ANALYSIS: DAILY CHART (AUGUST 2018 TO AUGUST 2019) (CHART 4)
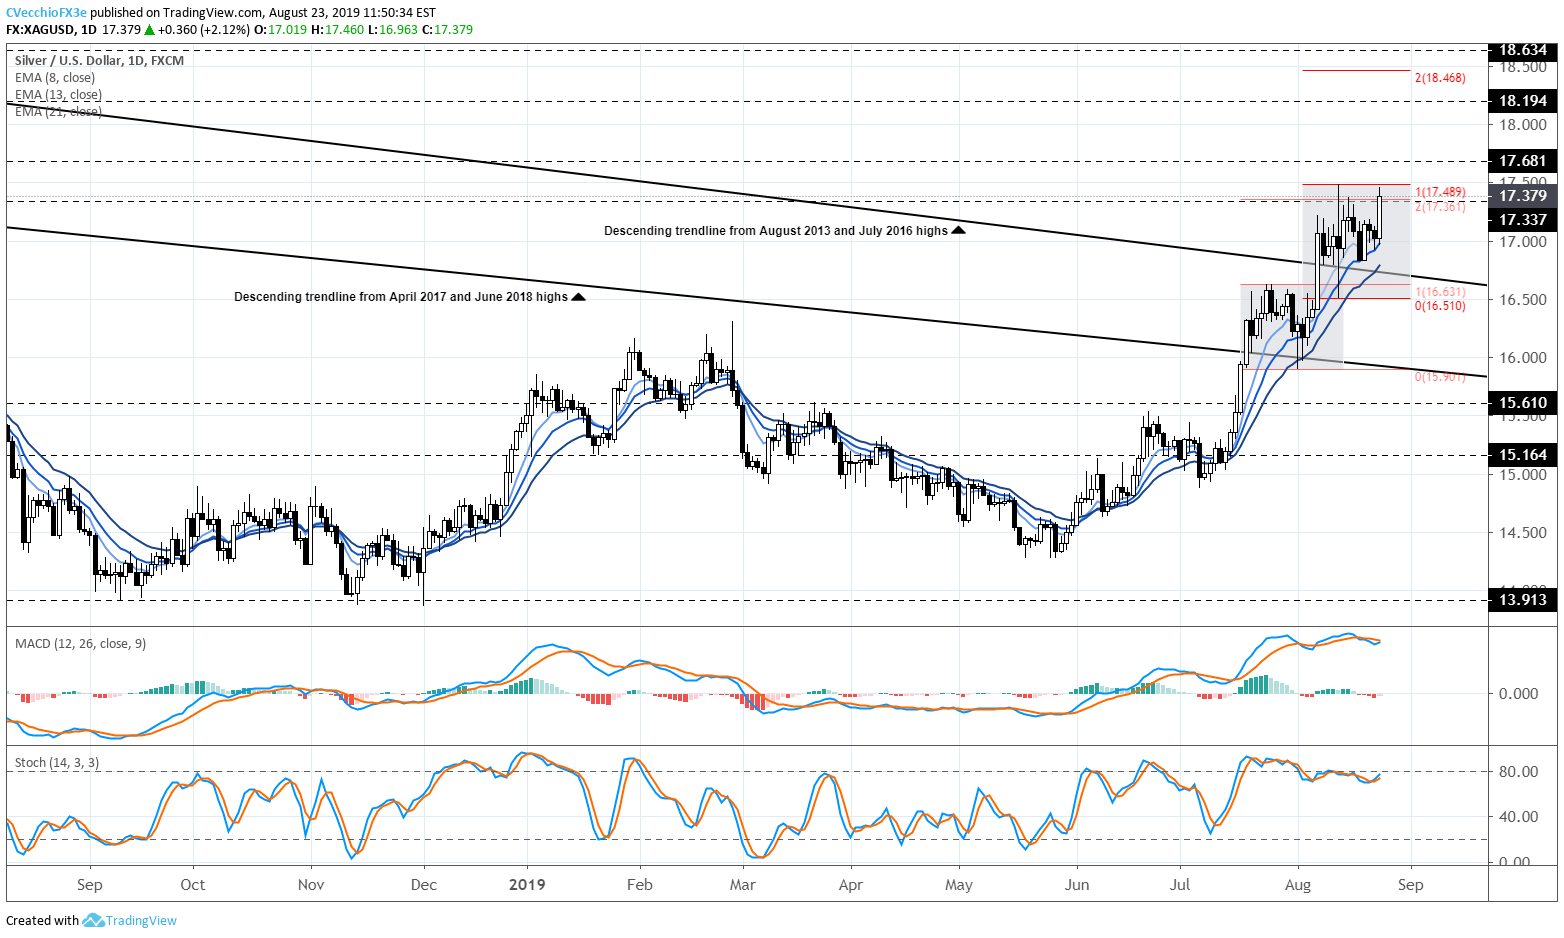
After achieving the bullish measured move from the mid-July/early-August consolidation at 17.361, silver prices have been trapped by the doji candle on August 13. A break above near-term doji resistance at 17.489 would signal a bullish continuation effort for silver prices. The measured move now calls for silver prices to trade into 18.468. With silver prices above their daily 8-, 13-, and 21-EMA, and both daily MACD and Slow Stochastics pointing higher again in bullish or overbought territory, the past of least resistance is higher, still.
IG Client Sentiment Index: Spot Silver Price Forecast (August 23, 2019) (Chart 5)
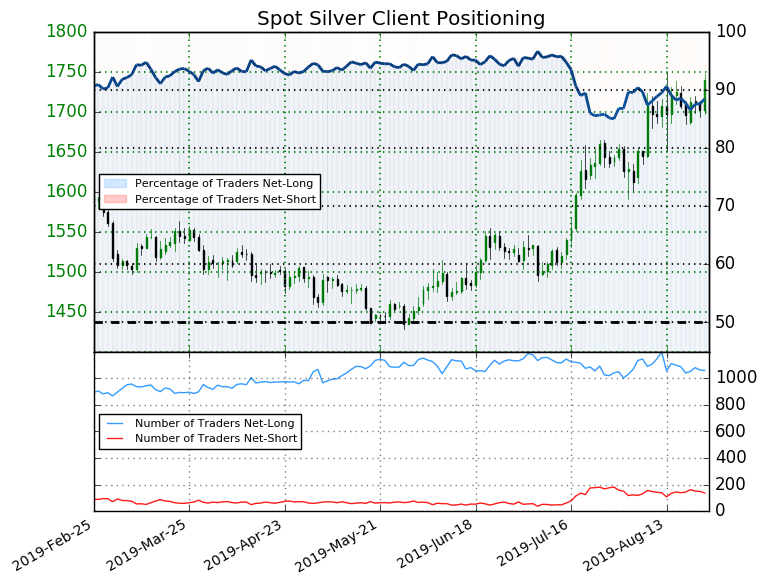
Spot silver: Retail trader data shows 88.5% of traders are net-long with the ratio of traders long to short at 7.67 to 1. The number of traders net-long is 0.6% lower than yesterday and 2.6% lower from last week, while the number of traders net-short is 11.5% lower than yesterday and 4.2% lower from last week.
We typically take a contrarian view to crowd sentiment, and the fact traders are net-long suggests Spot Silver prices may continue to fall. Traders are further net-long than yesterday and last week, and the combination of current sentiment and recent changes gives us a stronger spot silver-bearish contrarian trading bias.
FX TRADING RESOURCES
Whether you are a new or experienced trader, DailyFX has multiple resources available to help you: an indicator for monitoring trader sentiment; quarterly trading forecasts; analytical and educational webinars held daily; trading guides to help you improve trading performance, and even one for those who are new to FX trading.
--- Written by Christopher Vecchio, CFA, Senior Currency Strategist
To contact Christopher Vecchio, e-mail at cvecchio@dailyfx.com
Follow him on Twitter at @CVecchioFX
View our long-term forecasts with the DailyFX Trading Guides


