


- Gold prices reach exhaustion off initial resistance target- risk for further losses near-term
- Check out our 2019 projections in our Free DailyFX Gold Trading Forecasts
- Join Michael for Live Weekly Strategy Webinars on Mondays at 12:30GMT
Gold prices reversed off the first major resistance target at the 100% extension of the 2016 advance and leaves the broader XAU/USD breakout vulnerable near-term. These are the updated targets and invalidation levels that matter on the XAU/USD charts this week. Review this my latest Strategy Webinar for an in-depth breakdown of this Gold trade setup and more.
New to Gold Trading? Get started with this Free How to Trade Gold -Beginners Guide
Gold Price Chart - XAU/USD Daily
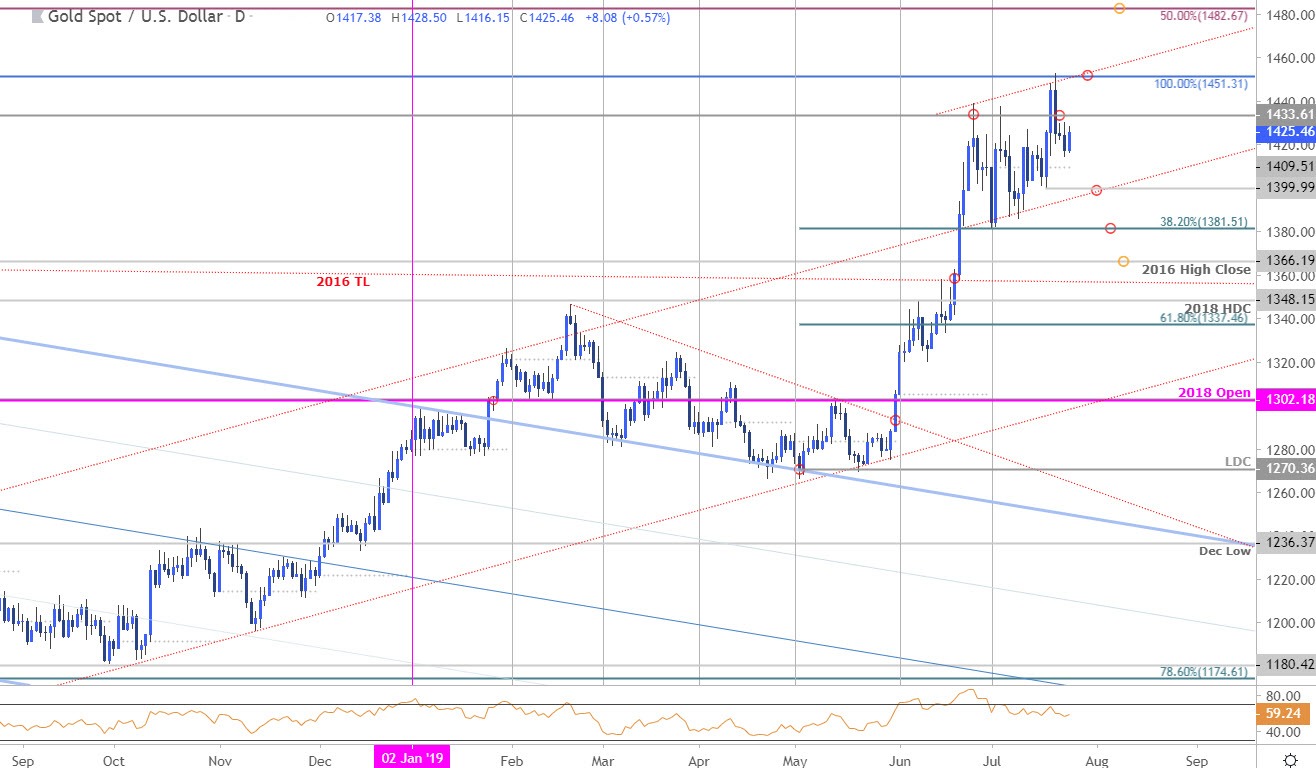
Technical Outlook: In my latest Gold Price Weekly Outlook we noted that XAU/USD was approaching resistance at, “the August 2013 high at 1433. A breach / close above this threshold is needed to validate the breakout with such a scenario eyeing subsequent resistance targets at 1451 backed by the 50% retracement of the decline off the record highs at 1483.” A subsequent breach the following day registered a high at 1452 before marking an outside reversal candle on building divergence off the highs to close back below the 1433 pivot zone.
The advance is vulnerable below this level near-term with monthly open support eyed at 1409 with broader bullish invalidation set to the 38.2% retracement of the yearly range at 1382. Topside resistance objectives steady at 1451 & 1483.
Gold Price Chart - XAU/USD 120min
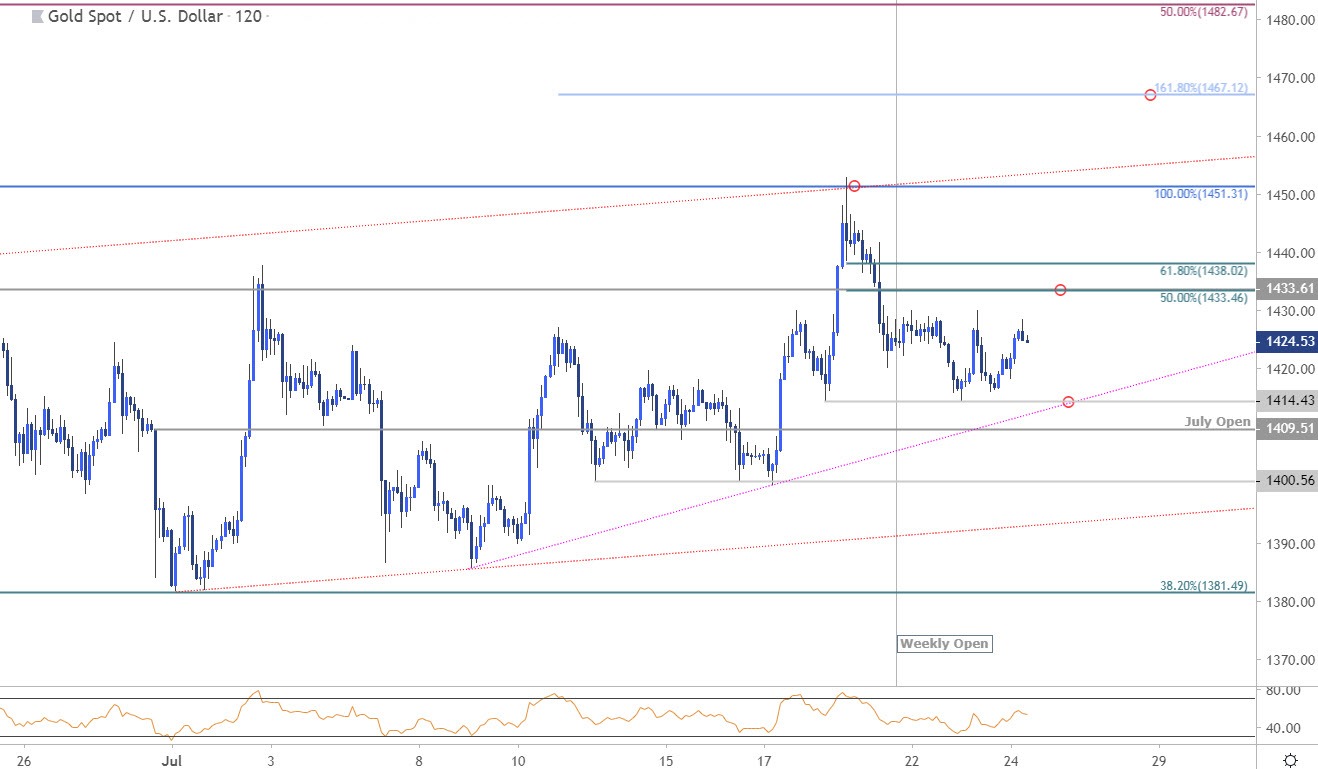
Notes: A closer look at gold price action shows XAU/USD holding within the confines of a well-defined weekly opening-range just below the 1433 level. Ultimately a breach above the 61.8% retracement at 1438 would be needed to mark resumption of the broader uptrend. Initial support rests at 1414 with a break below 1409 risking a larger correction in gold prices.
Why does the average trader lose? Avoid these Mistakes in your trading
Bottom line: Gold is holding a tight weekly range with the broader rally at risk near-term sub-1438. From a trading standpoint, the immediate focus is on a break of the weekly opening range – that said, the larger breakout remains vulnerable below last week’s highs. Ultimately, a larger correction may offer more favorable long-entries closer to trend support. Review my latest Gold Weekly Technical Outlook for a longer-term look at the technical picture for XAU/USD prices.
For a complete breakdown of Michael’s trading strategy, review his Foundations of Technical Analysis series on Building a Trading Strategy
Gold Trader Sentiment
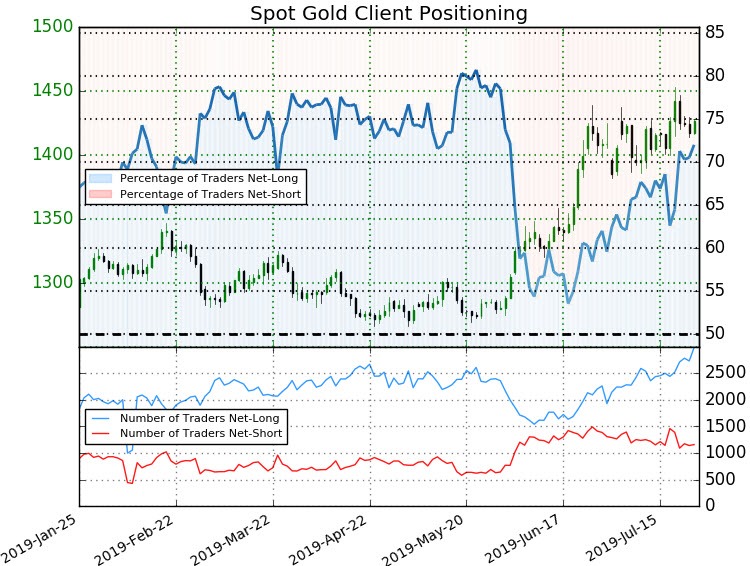
- A summary of IG Client Sentiment shows traders are net-long Gold- the ratio stands at +2.57 (72.0% of traders are long) – bearishreading
- Long positions are10.1% higher than yesterday and 16.2% higher from last week
- Short positions are1.8% lower than yesterday and 5.5% lower from last week
- We typically take a contrarian view to crowd sentiment, and the fact traders are net-long suggests Spot Gold prices may continue to fall. Traders are further net-long than yesterday & last week, and the combination of current positioning and recent changes gives us a stronger Spot Gold-bearish contrarian trading bias from a sentiment standpoint.
See how shifts in Gold retail positioning are impacting trend- Learn more about sentiment!
---
Active Trade Setups
- Canadian Dollar Price Chart: USD/CAD Breaks Out – Loonie Trade Levels
- Oil Price Chart: Crude Crushed Down to Support – WTI Trade Levels
- Sterling Price Chart: British Pound Testing Post-Brexit Support
- Written by Michael Boutros, Currency Strategist with DailyFX
Follow Michael on Twitter @MBForex


