


- Gold prices reverse off near-term resistance- trade remains constructive above 1180
- Check out our 3Q projections in our Free DailyFX Gold Trading Forecasts
- Join Michael for Live Weekly Strategy Webinars on Mondays at 12:30GMT
Gold prices posted an outside-day reversal off confluence support earlier this week with the decline now targeting near-term uptrend support. Here are the updated targets and invalidation levels that matter on the XAU/USD charts heading into the close of the month. Review this week’s Strategy Webinar for an in-depth breakdown of this setup and more.
Gold Daily Price Chart (XAU/USD)

Technical Outlook: In our previous Gold Technical Outlook noted that, “From a trading standpoint, I’ll favor fading weakness while above 1180 with a breach / close above 1215 needed to fuel the next leg higher in gold prices.” Bullion registered a high at 1214 this week before posting an outside-day reversal off near-term slope resistance.
Daily support rests at 1193 – a hold above this level is needed to keep the immediate advance viable. A topside breach of this pivot zone targets the median-line / monthly open at 1224 backed by the upper parallel / December low at 1236.
New to Forex Trading? Get started with this Free Beginners Guide
Gold 120min Price Chart (XAU/USD)

Notes: A closer look at price action sees gold trading within the confines of a modified pitchfork extending off the monthly lows with the lower parallel further highlighting near-term confluence support at 1193. Key support and broader bullish invalidation remains steady at 1180. Weekly open resistance stands at 1207 with a breach above 1215 targeting subsequent objectives at 1224 and 1236/38.
Why does the average trader lose? Avoid these Mistakes in your trading
Bottom line: Immediate risk is lower from here but ultimately a pullback should offer more favorable long-entries while above 1180. From a trading standpoint, look for a reaction at 1194 for immediate guidance with a breach above the weekly opening-range highs needed to mark resumption of the broader recovery in gold prices.
For a complete breakdown of Michael’s trading strategy, review his Foundations of Technical Analysis series on Building a Trading Strategy
Gold Trader Sentiment
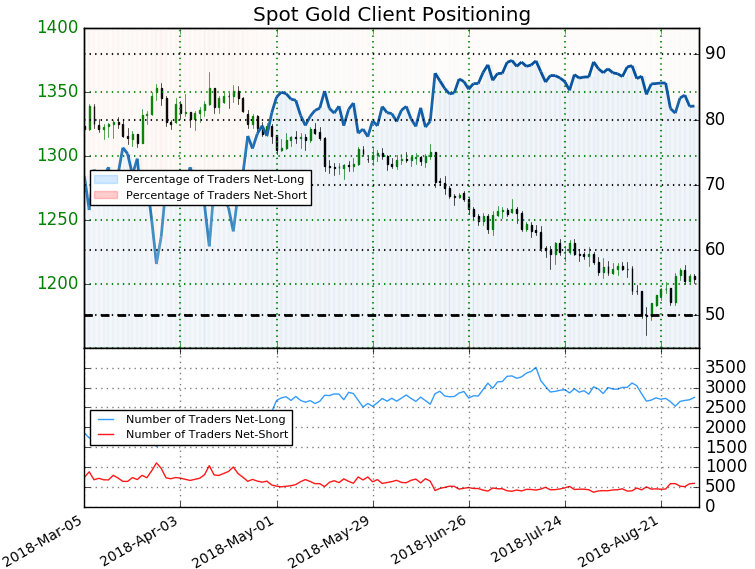
- A summary of IG Client Sentiment shows traders are net-long Gold - the ratio stands at +4.58 (82.1% of traders are long) – bearishreading
- Long positions are1.8% higher than yesterday and 4.0% higher from last week
- Short positions are 5.8% higher than yesterday and 0.8% higher from last week
- We typically take a contrarian view to crowd sentiment, and the fact traders are net-long suggests Gold prices may continue to fall. Positioning is less net-long than yesterday but more net-long from last week. The combination of current positioning and recent changes gives us a further mixed Spot Gold trading bias from a sentiment standpoint.
See how shifts in Gold retail positioning are impacting trend- Learn more about sentiment!
---
Economic Calendar - latest economic developments and upcoming event risk. Learn more about how we Trade the News in our Free Guide !
Active Trade Setups
- Crude Oil Price Outlook: WTI Reversal Approaching Initial Targets
- EUR/USD Price Outlook: Euro Continuation Prospects after Fresh Highs
- USD/CAD Price Outlook: Loonie Threatens Breakout on Easing Trade Tensions
- USD/JPY Price Outlook: Yen Reversal Faces Initial Resistance Hurdles
- AUD/USD Price Outlook: Aussie Recovery Faces Major Resistance Hurdle
- USD/CHF Price Outlook: Pending Swissy Technical Breakout
- Written by Michael Boutros, Currency Strategist with DailyFX
Follow Michael on Twitter @MBForex or contact him at mboutros@dailyfx.com


