


Talking Points:
- Gold prices put in an aggressive top-side breakout this morning, testing into a longer-term area of resistance before a strong reversal began to show.
- The reversal in Gold prices produced a pin bar on the four-hour chart, and prices are moving back-down after this morning’s excitement.
- Are you looking to improve your trading approach? Check out Traits of Successful Traders. And if you’re looking for an introductory primer to the Forex market, check out our New to FX Guide.
Do you want to see how retail traders are currently positioned around Gold? Click here for IG Client Sentiment.
Gold Prices Put in Aggressive Breakout – and Then Pull Back
It’s been a climactic day for Gold prices, and matters got started early as a tweet from President Donald Trump sent the yellow metal flying before New York traders had even gotten to their desks to start the day. After Gold prices had spent most of the past two-and-a-half months in a bearish channel, bulls forced a push-higher this morning, leading to a topside break of that channel as prices surged into the long-term zone of resistance we looked at last week.
Gold Four-Hour Chart: Prices Test Resistance Before Bears Push Prices Back-Down
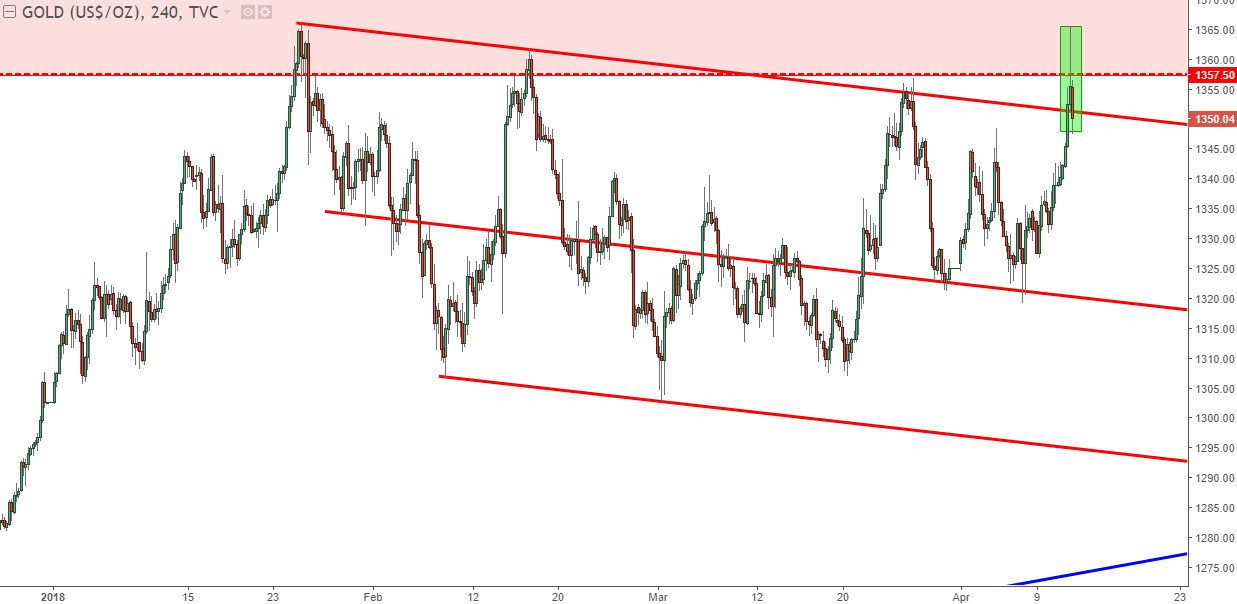
Chart prepared by James Stanley
Resistance Zone Holds the Highs
The longer-term zone of resistance encapsulates the highs from the past two years. The 2016 high at $1375.15 and the 2017 high at $1,357.50 help to demarcate a zone that’s held the 2018 highs, at least so far. A look at the weekly chart will help to illustrate longer-term dynamics behind Gold prices, as this bearish channel takes place as a corrective move within a longer-term bullish channel. The zone of resistance that runs up to $1,375 has been a hindrance to topside continuation, as we’ve now seen multiple tests fail in this area.
Gold Weekly Chart: Longer-Term Bullish Channel with Resistance Hindering Continuation

Chart prepared by James Stanley
This morning’s quick burst of strength was unable to last, and bears quickly pushed prices right back-below that zone of resistance. This keeps setups on both sides of Gold prices, as bulls can look for support at prior areas of short-term resistance while bears have a bearish reversal pattern to work with.
On the bearish side, the four-hour chart is showing a pin bar formation. Pin bars are reversal formations, highlighted by elongated wicks ‘sticking out’ from prior points of resistance. This can open the door for reversal setups, looking for this morning’s strength to continue to dissipate as prices return towards the $1,335 area.
Gold Four-Hour Chart: Bearish Pin Bar Formation at Long-Term Zone of Resistance

Chart prepared by James Stanley
On the bullish side, there’s two different ways of approaching the matter. In our last article, we looked at playing topside breakouts once this longer-term zone of resistance is resolved, and that remains as a potential strategy. For those that don’t want to wait for a breakout before looking to the long side of Gold prices, there’s potential support around prior areas of resistance that can keep the prospect of bullish continuation as attractive. The area around $1,344 has been constructive, as has the area around $1,335. The key here would be waiting for support to actually develop, indicating that the bearish reversal showing currently may have met its end so the longer-term up-trend may be ready to advance.
Gold Four-Hour Chart: Support Potential Around Prior Points of Interest

Chart prepared by James Stanley
To read more:
Are you looking for longer-term analysis on Gold prices? Our DailyFX Forecasts for Q1 have a section specifically for Gold. We also offer a plethora of resources on our Gold page, and traders can stay up with near-term positioning via our IG Client Sentiment Indicator.
Forex Trading Resources
DailyFX offers a plethora of tools, indicators and resources to help traders. For those looking for trading ideas, our IG Client Sentiment shows the positioning of retail traders with actual live trades and positions. Our trading guides bring our DailyFX Quarterly Forecasts and our Top Trading Opportunities; and our real-time news feed has intra-day interactions from the DailyFX team. And if you’re looking for real-time analysis, our DailyFX Webinars offer numerous sessions each week in which you can see how and why we’re looking at what we’re looking at.
If you’re looking for educational information, our New to FX guide is there to help new(er) traders while our Traits of Successful Traders research is built to help sharpen the skill set by focusing on risk and trade management.
--- Written by James Stanley, Strategist for DailyFX.com
To receive James Stanley’s analysis directly via email, please SIGN UP HERE
Contact and follow James on Twitter: @JStanleyFX


