


Talking Points:
- Gold prices have continued to gyrate within a downward-sloping channel after setting a fresh yearly-high in late-January. Support thus far has held above $1,300; but short-term charts show a continued response from sellers, pointing to the possibility of near-term down-side before the longer-term bullish trend might be ready for resumption.
- The next two weeks bring a heightened focus around the US Dollar, and Gold as the ‘Anti-Dollar’ will likely be along for the ride. Tomorrow brings US CPI, and next week brings a Federal Reserve rate decision, currently carrying an 89% probability of a hike.
- Are you looking to improve your trading approach? Check out Traits of Successful Traders. And if you’re looking for an introductory primer to the Forex market, check out our New to FX Guide.
To receive James Stanley’s Analysis directly via email, please sign up here
Gold Prices Gyrate After Rallying-Up to Fresh Yearly Highs
Gold prices were on a tear as we came into 2018, extending the rally that had started in mid-December to go along with another bearish kick to the US Dollar. After setting support at $1,236 in December, prices were almost $130 higher just six weeks later. But since that fresh yearly high posted in late-January, buyers have been unable to muster any significant strength, and Gold prices continue to gyrate within a bearish channel, connecting the post-January highs and the post-January lows.
Gold Price Chart: Bearish Channel Builds After Print of Fresh Yearly Highs Above $1,357.50

Chart prepared by James Stanley
Fibonacci Support Bending, But Not Yet Broken on the Daily Chart
It hasn’t yet been an entirely negative story in Gold since that high was set, as that bearish channel has come along with a respectable response at support. Adding a Fibonacci retracement to the bullish move looked at above shows a 38.2% retracement at $1,316.63, and this has largely helped to hold support in the pair on a Daily basis. Intra-day, this has been messy, but it’s notable that we haven’t seen a daily close below this price since the first incursion earlier in February.
Gold Price Chart: Daily Time Frame, Fibonacci Support Bending, Not Yen Broken by Daily Close in March

Chart prepared by James Stanley
The Anti-Dollar
The next couple of weeks could be volatile for the US Dollar. Tomorrow morning brings US CPI for the month of February, and next Wednesday brings a FOMC rate decision with the high-expectation of getting a rate hike. This could also play out in Gold, as the build of that bearish channel syncs well with the US Dollar trying to set support throughout February. Nonetheless, traders should be careful with banking on a support break of a level that’s held-up fairly well in the face of increasing pressure over the past few weeks.
Longer-Term Stances in Gold
On a longer-term basis, we’d be looking at an immature bull flag formation, given the recently-started bearish channel at the top of a strong bullish run. But, near-term price action remains messy, and it can be difficult to voice that longer-term view until we see a more relevant level come into play. A top-side break of the March high at $1,340.50 opens the door for bullish approaches, with targets set towards $1,350, $1,357.50 and then the 2018 high at $1,366.06.
Conversely, breaks below the 50% retracement open the door to a deeper sell-off, with next supports cast towards $1,296, and then $1,286.09.
Shorter-Term Approaches in Gold
Shorts can be investigated on a resistance test around the 23.6% retracement at $1,335.52, which had helped to carve out the highs last Tuesday. That high from last Tuesday came-in shy of the prior swing high, at $1,341.04 and $1,340.50, respectively, and this would be looking for another lower-high to continue the sequence. This would allow for stops above $1,341.04 with targets set to the current swing-high of $1,324.05; affording a better than one-to-one risk-reward ratio. If resistance does not show between $1,335.52 and $1,340.49, then the bearish trade is nullified by fresh highs. Secondary targets can be set to the 38.2% Fibonacci retracement at $1,316.63; and if we do finally get a Daily close below this level, tertiary targets can be set to the 50% retracement at $1,301.36.
Gold Price Chart: Four-Hour Time-Frame, Resistance Zone Applied
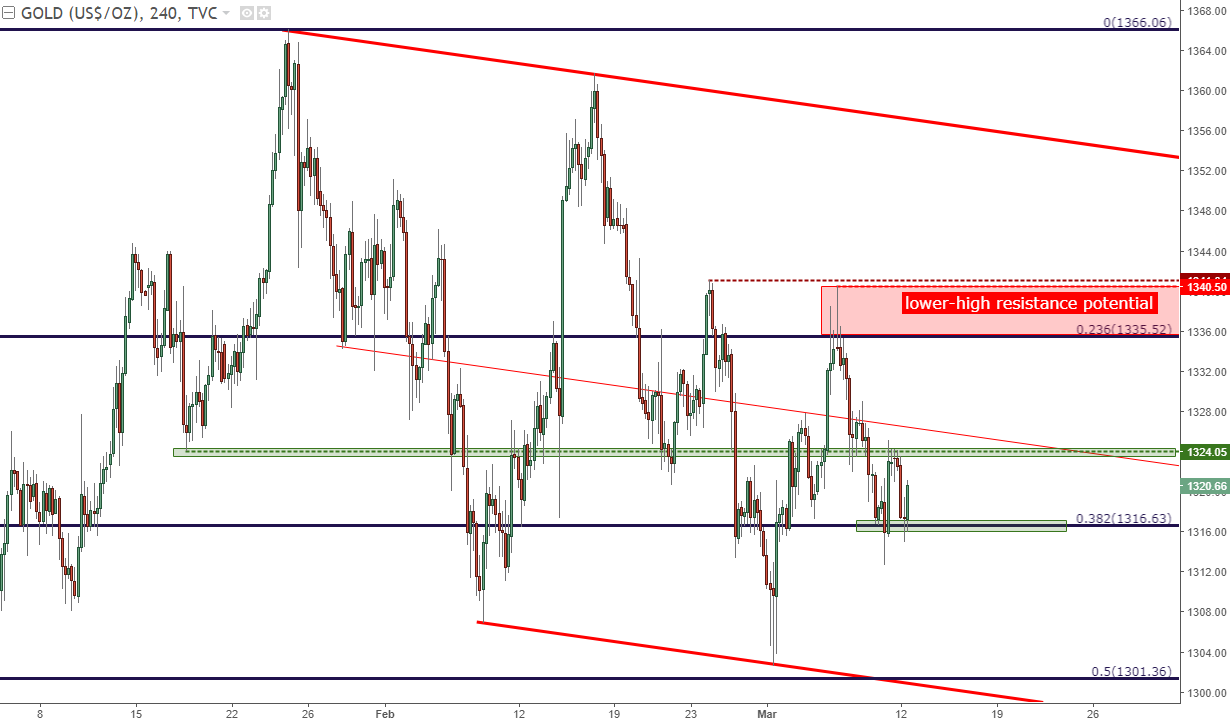
Chart prepared by James Stanley
To read more:
Are you looking for longer-term analysis on Gold prices? Our DailyFX Forecasts for Q1 have a section specifically for Gold. We also offer a plethora of resources on our Gold page, and traders can stay up with near-term positioning via our IG Client Sentiment Indicator.
Forex Trading Resources
DailyFX offers a plethora of tools, indicators and resources to help traders. For those looking for trading ideas, our IG Client Sentiment shows the positioning of retail traders with actual live trades and positions. Our trading guides bring our DailyFX Quarterly Forecasts and our Top Trading Opportunities; and our real-time news feed has intra-day interactions from the DailyFX team. And if you’re looking for real-time analysis, our DailyFX Webinars offer numerous sessions each week in which you can see how and why we’re looking at what we’re looking at.
If you’re looking for educational information, our New to FX guide is there to help new(er) traders while our Traits of Successful Traders research is built to help sharpen the skill set by focusing on risk and trade management.
--- Written by James Stanley, Strategist for DailyFX.com
To receive James Stanley’s analysis directly via email, please SIGN UP HERE
Contact and follow James on Twitter: @JStanleyFX


