


Talking Points:
- Gold prices broke below the neckline of a short-term head and shoulders pattern.
- Retail traders are still on the long side of Gold, which may be indicating a deeper pullback..
- Are you looking to improve your trading approach? Check out Traits of Successful Traders. And if you’re looking for an introductory primer to the Forex market, check out our New to FX Guide.
To receive James Stanley’s Analysis directly via email, please sign up here
Gold Breaks the Neck
Last week saw a bit of strength show up in the US Dollar, and this helped to soften Gold prices as a series of lower-lows and highs showed-up in the early part of the week. We had zeroed-in on a head and shoulders pattern with a neckline around the $1,326 level on Monday. That neckline support gave way on Tuesday, and prices continued their slide on Wednesday and Thursday until a deeper area of support began to show around $1,307, which was the 3rd area of support that we were looking at last Monday.
Gold Prices Break Neck-Line, Sink to $1,307.50 Support
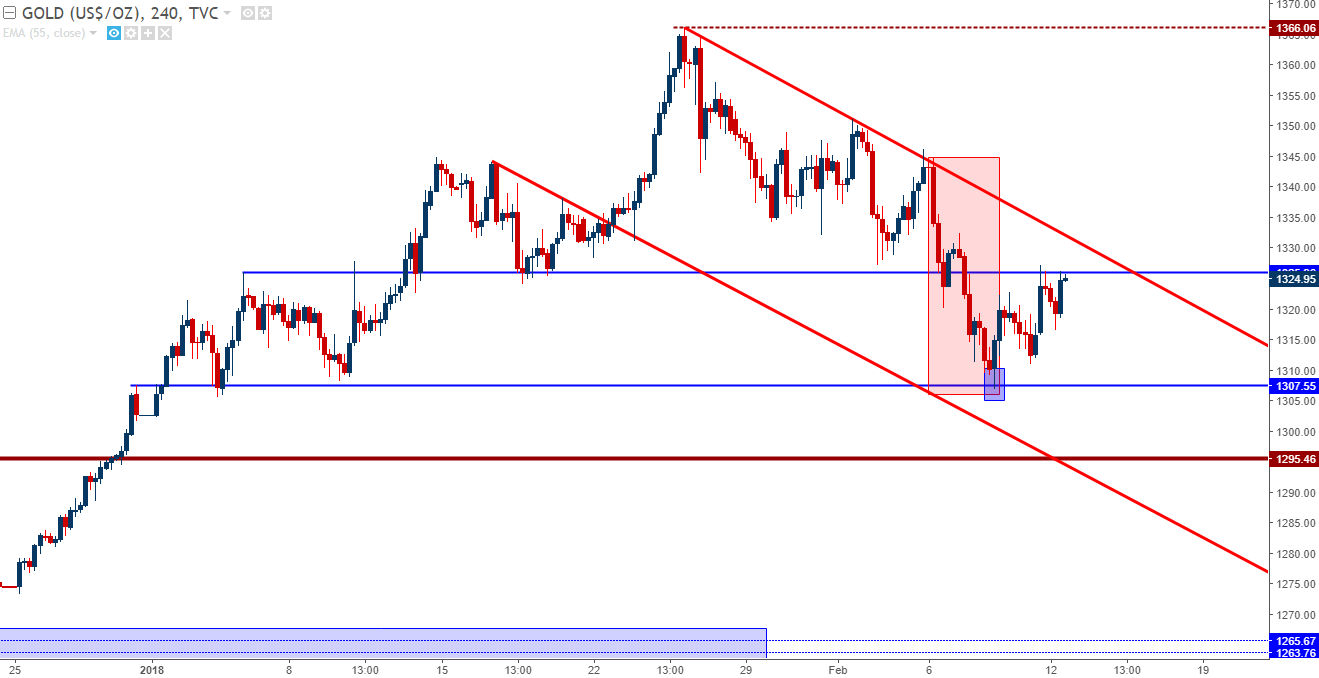
Chart prepared by James Stanley
Former Neck-Line as New Resistance
For the head and shoulders pattern that we looked at last week to complete, prices would need to put in a bearish move that matches the approximate distance from the neck-line to the top of the head, which we had estimated as roughly $40; and when subtracting that from the rounded neck-line value of $1326, we’d have a longer-term target towards $1,286 ($1366 (high) - $1326 (Neckline) = $40; $1326 - $40 = $1286).
So, at this point we’ve only seen roughly half of that pattern fill in, and prices pulled back from the bearish move after our third level of support was hit on Thursday morning. As this week’s trading opened, that bullish move in Gold prices continued, and we’re now seeing resistance show-up at the same prior support that had previously demarcated the neck-line.
Gold Four-Hour Chart: Resistance From Prior Support

Chart prepared by James Stanley
Rising Wedge Off the Lows
The resistance that we looked at above is getting a bit more worn as the session continues. On the hourly chart below, we can see multiple tests at that area that, as of yet, have been unable to tilt prices-lower. This should be disconcerting for short-side stances that are looking to take on exposure with current levels, as this shorter-term rising wedge may be indicating a deeper bullish move before bears are ready to come-back into Gold.
For shorter-term stances that are looking for a more aggressive risk-reward and are willing to take a higher-probability of eating a stop, the current setup can be worked with: The previous swing-high around $1,332 could be used for stop placement, which could be justified with a better than 1:1 risk-reward ratio if using targets at $1,312.40.
Gold Hourly: Knocking on the Door of Resistance
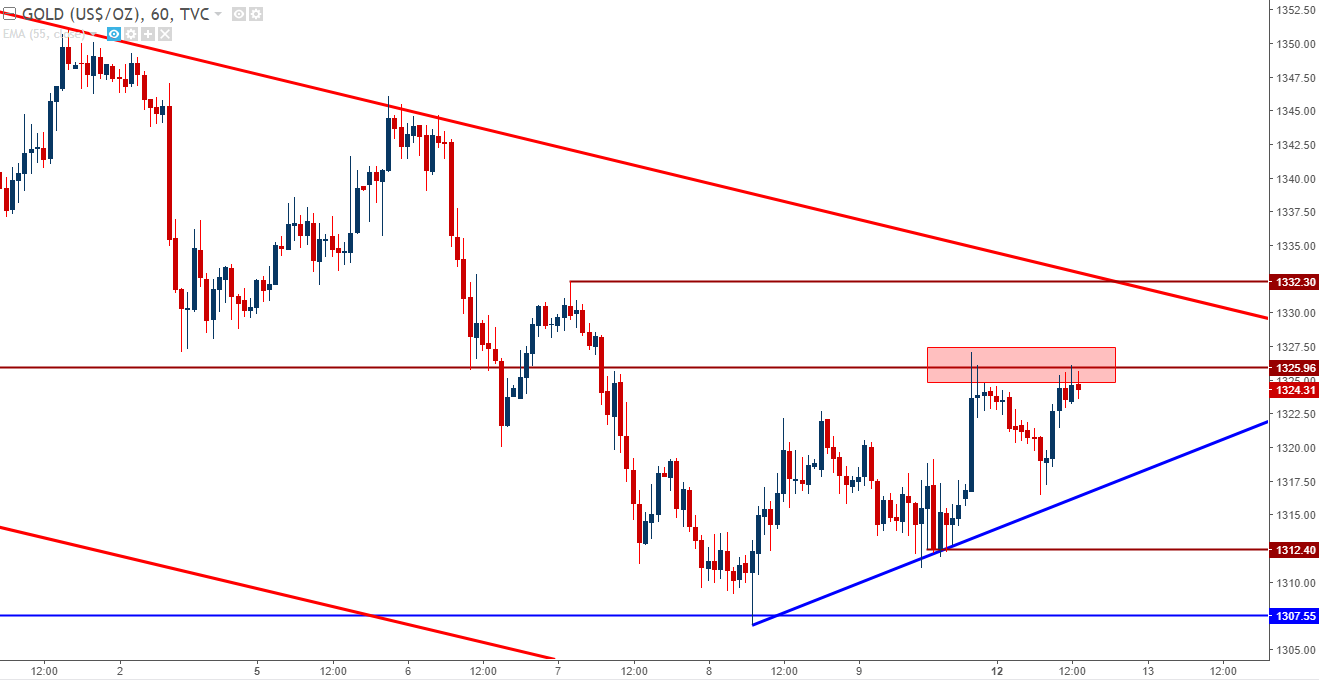
Chart prepared by James Stanley
For longer-term stances
For longer-term stances or for those looking to treat the move a bit more conservatively, awaiting a break of the short-term bullish trend-line could be a strong signal that the selling is back and may run for a while longer, perhaps even to that longer-term short-side target towards $1,286.
Gold Prices Four-Hour Chart
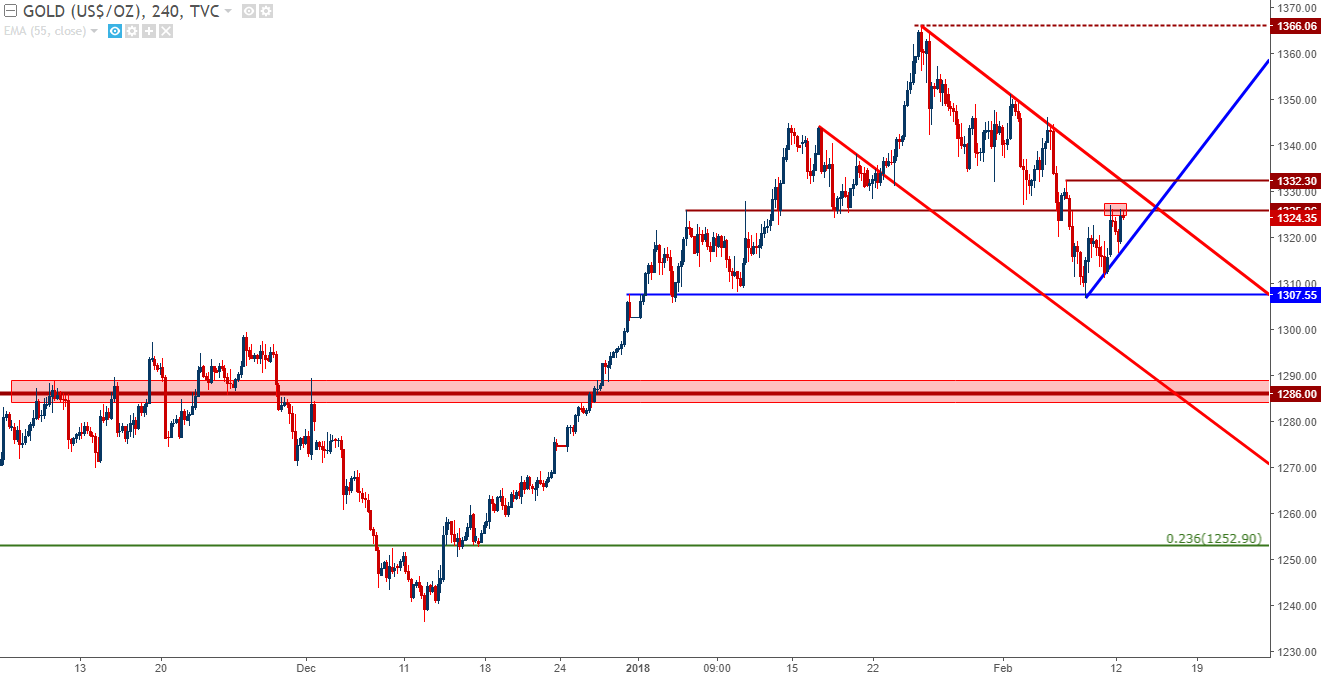
Chart prepared by James Stanley
To read more:
Are you looking for longer-term analysis on Gold prices? Our DailyFX Forecasts for Q1 have a section specifically for Gold. We also offer a plethora of resources on our Gold page, and traders can stay up with near-term positioning via our IG Client Sentiment Indicator.
Chart prepared by James Stanley
--- Written by James Stanley, Strategist for DailyFX.com
To receive James Stanley’s analysis directly via email, please SIGN UP HERE
Contact and follow James on Twitter: @JStanleyFX


