


Talking Points:
- Gold prices put in another resistance test last week, but bulls were unable to break above $1,300.
- Retail traders are aggressively long Gold with IG Client Sentiment currently showing +4.04-to-1. Given retail traders’ traditional contrarian nature, this is a bearish indication.
- Looking for trade ideas? Check out our trading guides. And if you’re looking for something more interactive in nature, check out our DailyFX Webinars.
To receive James Stanley’s Analysis directly via email, please sign up here
In our last article, we looked at Gold prices in the midst of sideways price action that had lasted for most of the previous month. And while I’d love to be able to regale you with stories of breakaway trends and momentum trades surging in either direction - that simply has not been the case: The range in Gold prices continues as we tread into the final month of 2017.
Coming into the year, Gold prices were dropping like a rock. This was on the back of the surge being seen in the U.S. Dollar as the ‘Trump Trade’ got further priced-through capital markets. But as that Dollar strength viciously turned into aggressive weakness in the first quarter of the year, Gold prices began to lift-higher. This lasted all the way into June, where a double top around the $1,296 level finally initiated some element of resistance. This is a level that remains resistant, as we saw just last week when price action tried to break through on Monday, Tuesday and Wednesday; only to fail as sellers pushed back down towards the confluent support zone that we’ve been following.
Gold Daily: Resistance Holds, Prices Re-Approach Confluent Support as Mean Reversion Continues
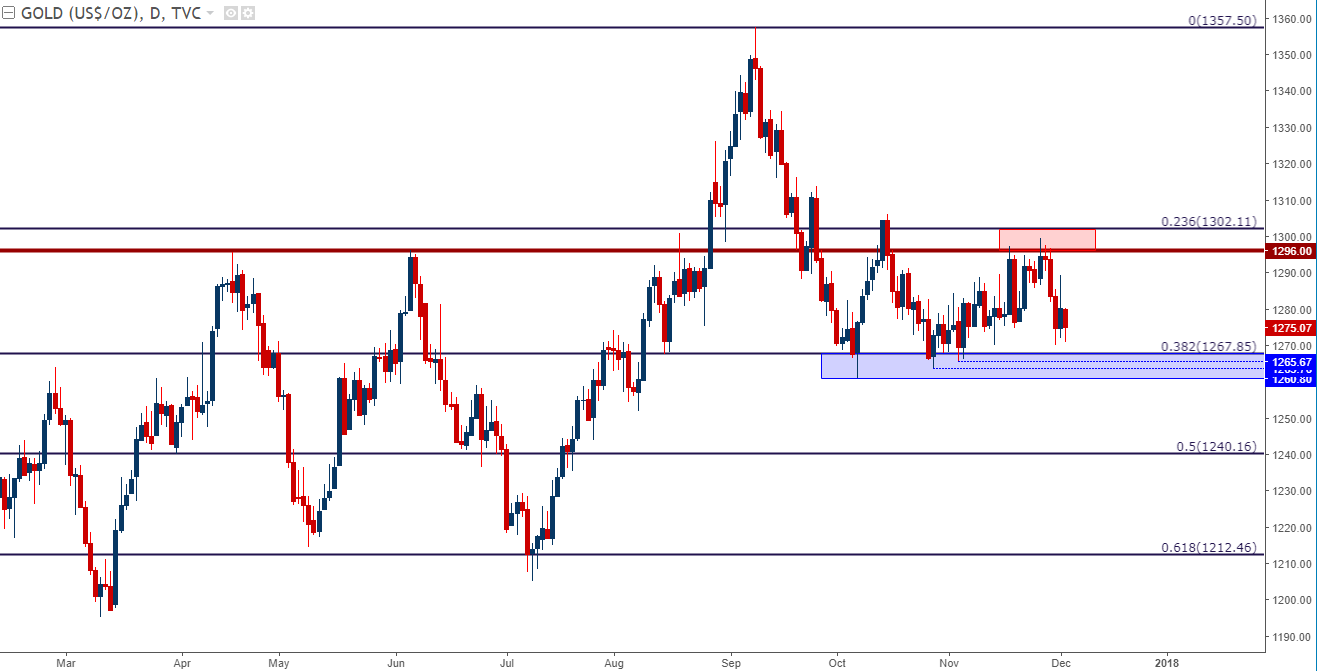
Chart prepared by James Stanley
In July, Gold strength began to show again, and for almost two full months bulls were in control. This lasted all the way until we ran-up to a fresh one-year high at $1,357.50 in September. After prices pulled back a portion of that move, support started to show around the 61.8% retracement with resistance continuing around the 38.2% level. This gives us near-by levels to work with in looking for the mean-reversion in Gold to finally give way. Support structure can be looked at from the October low up to the November low; a range comprising the levels of $1,260 to $1,265. On the resistance side of the coin, traders can follow the $1,296 double top up to the $1,306 October swing-high.
Once either of these sides give way, traders can begin plotting longer-term directional approaches in Gold. Until then, be cautious around getting caught in between the cracks of support and resistance on near-term Gold charts.
Gold Daily: Near-Term Range Break to Open Door to Longer-Term Directional Approaches
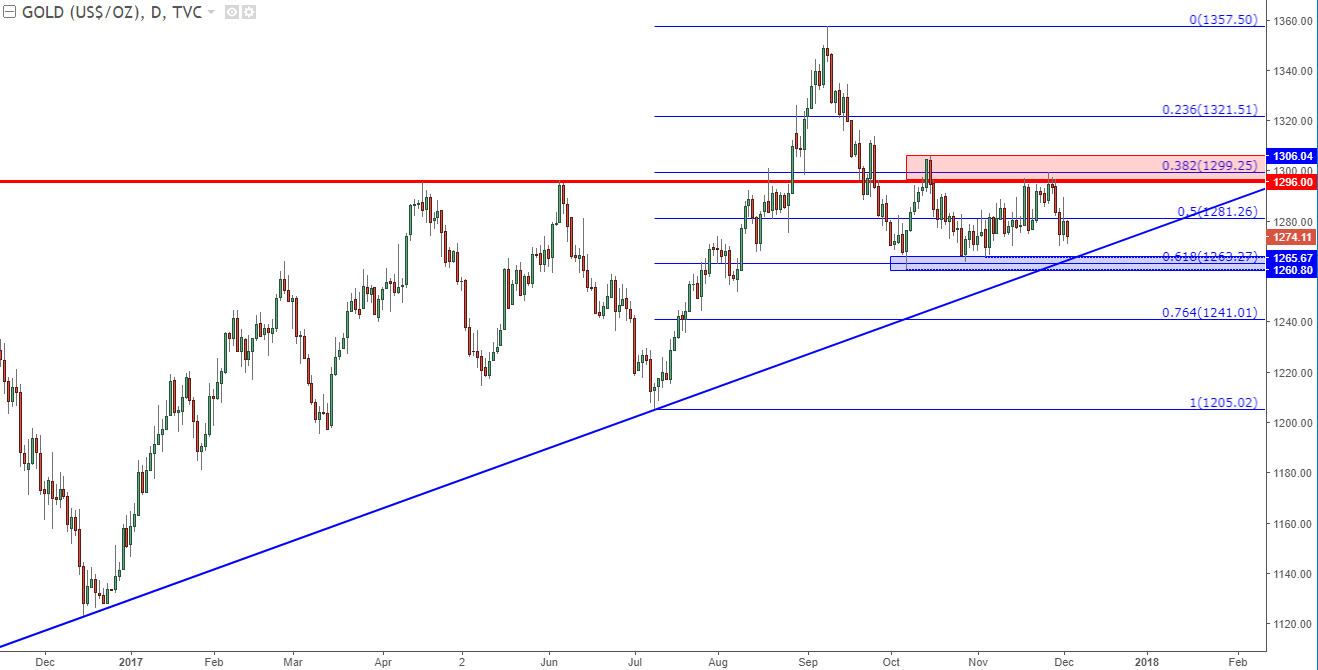
Chart prepared by James Stanley
--- Written by James Stanley, Strategist for DailyFX.com
To receive James Stanley’s analysis directly via email, please SIGN UP HERE
Contact and follow James on Twitter: @JStanleyFX


