


Talking Points:
- Gold prices found sellers today after an aggressively bullish week of price action last week.
- Non-Farm Payrolls earlier in October helped support build in Gold prices; and that move has largely continued into this week. After running into a batch of resistance around $1,300, are we on the cusp of a bearish reversal?
- Want to see the DailyFX Q4 Forecast on Gold and/or USD? Click here for full access.
To receive James Stanley’s Analysis directly via email, please sign up here
Last month, we looked at Gold prices after a key zone of resistance came into play in the area that runs from $1,350-$1,375. Throughout the summer of last year, there were a series of resistance points that came in via price action. As the recent bullish run encountered this area, we asked if the bullish run was finished, and at least for the time being, it was. After that fresh One-year high was set in early-September, bears took over to create a retracement that ran for more than $95 from the September high to the October low.
Gold Daily: Lower After Running into Resistance (Maroon), Support Shows after NFP (Green)
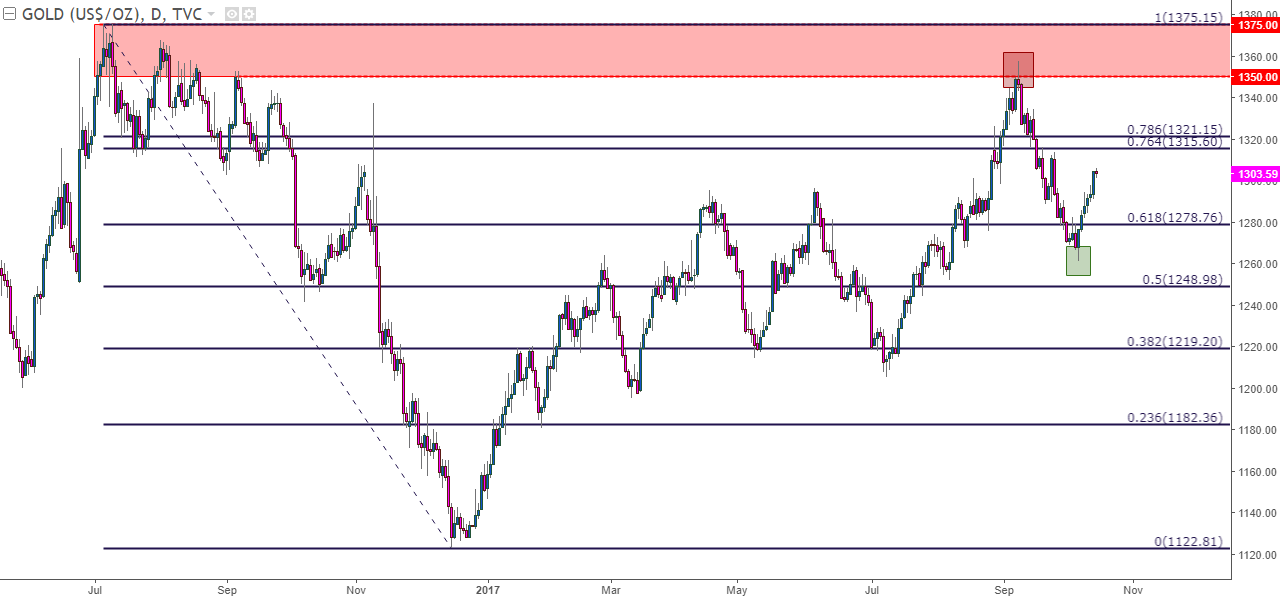
Chart prepared by James Stanley
It was around the release of Non-Farm Payrolls on October 6th that support began to show in Gold prices. Buyers stepped-in just above the $1,260 level after an abysmal NPF print, and since then it’s been mostly a one-way show as prices have trended-higher, eventually crossing above the $1,300 level before resistance began to show around $1,306.
Gold Prices Gain > $45 From NFP Low to Weekly High
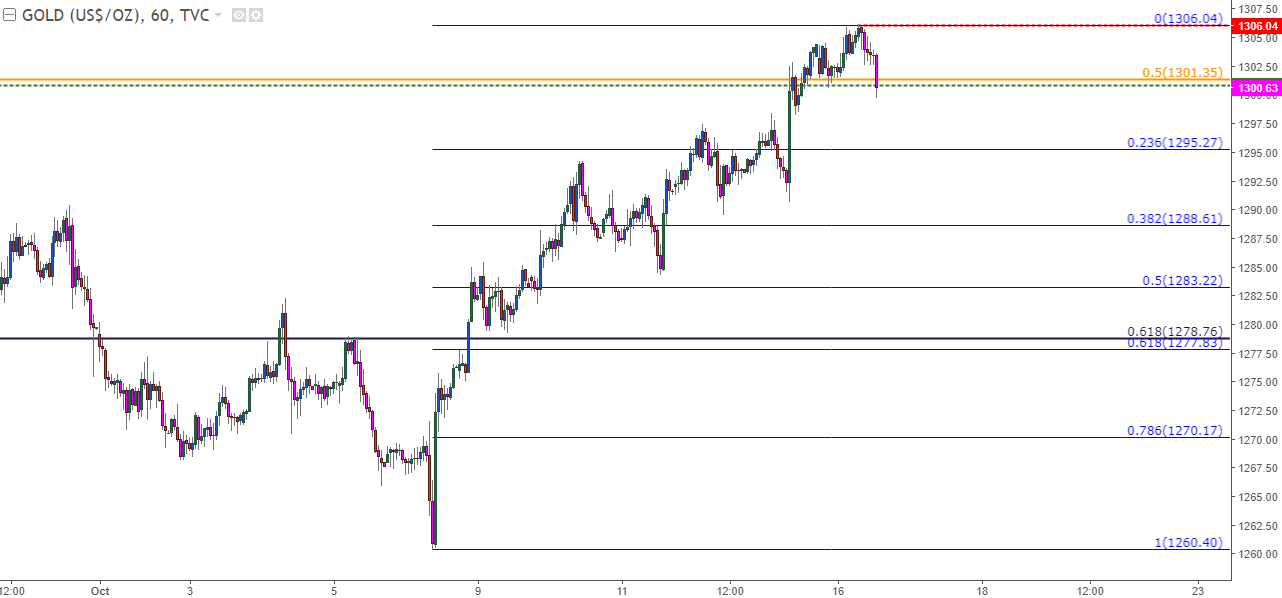
Chart prepared by James Stanley
The price of $1,301.35 is a key level in Gold prices, and can be seen above with the orange line on the chart. This is the 50% retracement of the post-Financial Collapse move in Gold prices, taking the low of $681.71 up to the $1,920.94 high.
Gold Weekly: $1,301.35 a Key Level, 50% of the post-Financial Collapse Move in Gold Prices
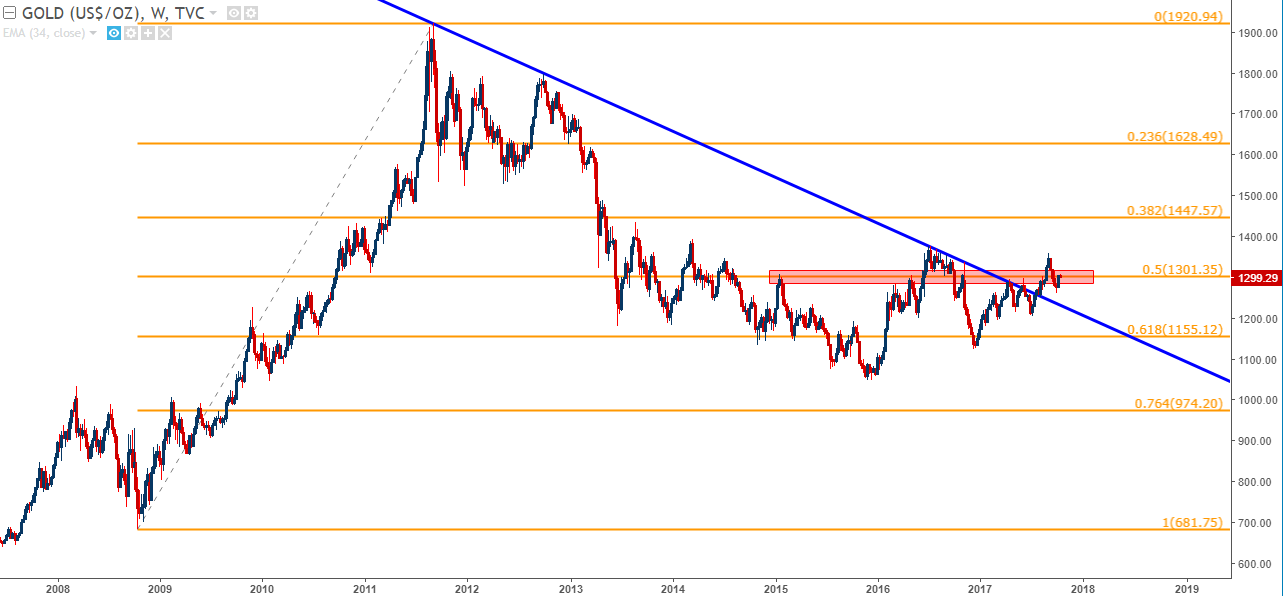
Chart prepared by James Stanley
If Gold prices are unable to hold support above $1,300 and perhaps more specifically $1,301.35, the door can be opened for a bearish retracement of this recent bullish move. The Fibonacci retracement drawn around that bullish move can assist with down-side targets around $1,296, $1,289, $1,284 and then $1,277.83, which is also a confluent level.
For the longer-term approach, traders will likely want to wait for some element of higher-low support to set-in before looking at topside exposure. While the bullish run in Gold prices over the past few weeks is attractive for continuation purposes, the lack of an adequate pullback can make continuation at this point a daunting prospect. If we do see support build-in around the $1,296 level, a case can be made for bullish continuation strategies with eyes on longer-term resistance areas around $1,315-$1,320.
Gold Hourly: Down-side Targets With Emphasis on Confluence ~$1,278
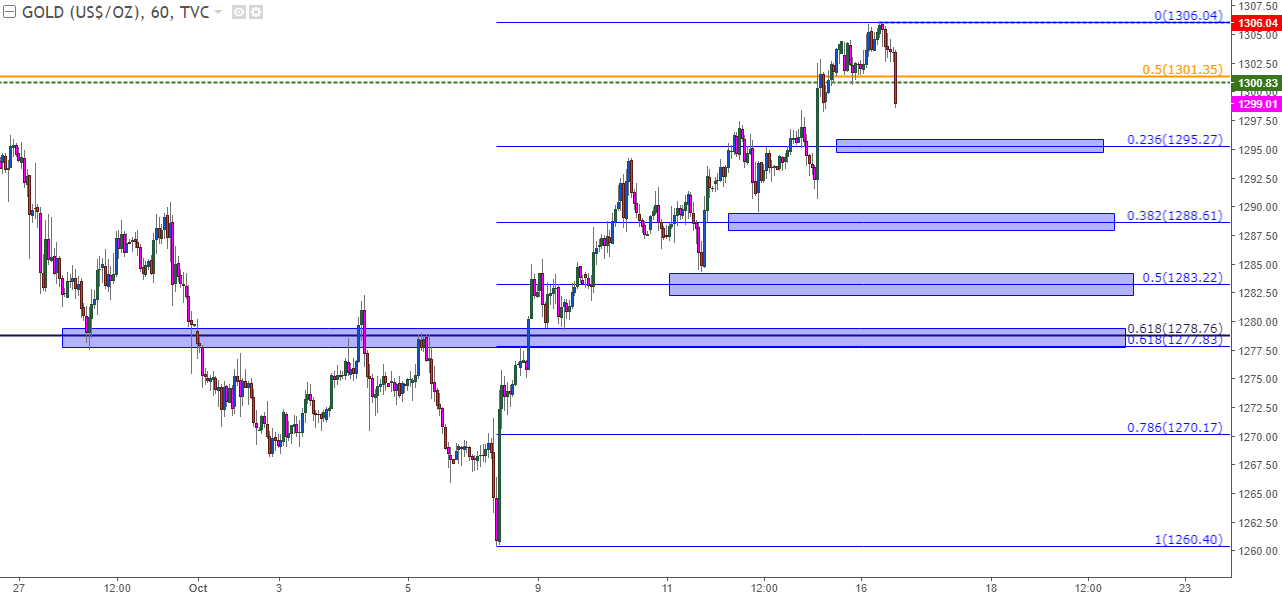
Chart prepared by James Stanley
--- Written by James Stanley, Strategist for DailyFX.com
To receive James Stanley’s analysis directly via email, please SIGN UP HERE
Contact and follow James on Twitter: @JStanleyFX


