Talking Points:
- Gold Prices dropped to open the week after the strongest German IFO Survey in 47 years.
- IG Client Sentiment in Gold is currently showing as +4.21-to-1, and this is a bearish indicator.
- If you’re looking for trading ideas, please check out our Trading Guides. And if you’re looking for live analysis or education, please check out our live webinars at DailyFX.
To receive James Stanley’s Analysis directly via email, please sign up here.
The week has started on a fleet foot for Gold prices, as the yellow metal has run down to set a new monthly low before the U.S. opens for business. The driver of the move appears to be a German IFO survey that printed at its strongest reading in 47 years, and this is the highest level that we’ve seen the indicator print since the reunification of Germany. With sentiment surveys, we’ll often see a type of leading relationship; so this IFO survey is highlighting that we may see a stronger pattern of growth in the months-ahead as Germany goes into an election cycle beginning in August.
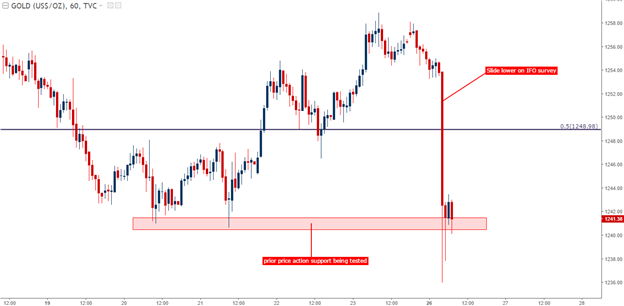
Last week we discussed an area of support in Gold prices around the $1,240-1,241 area. This morning’s precipitous slide in Gold prices descended right through that support, only for buyers to pick prices back-up above the level. On the chart below, we’re dialing in on this morning’s sell-off, and notice the large wicks on the right side of the chart as buyers have pulled prices back above this prior support level.

Chart prepared by James Stanley
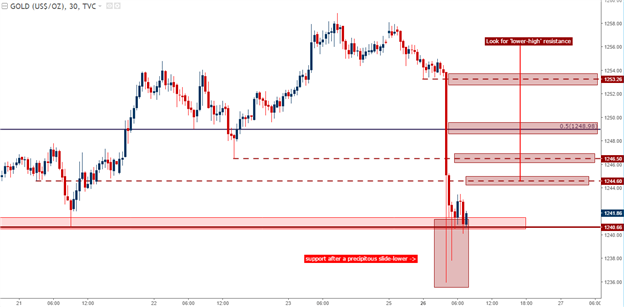
Given that we’ve seen an outsized move to open the week, we can associate the predominant trend as being bearish. But – given the four hours of price action that we’ve seen where buyers have pushed prices back above prior support at $1,240, and traders would probably want to wait for a better with nearby resistance rather than chasing the move. On the 30-minute chart below, we’re looking at four potential areas to watch for ‘lower-high’ resistance in trading the move-lower.

Chart prepared by James Stanley
--- Written by James Stanley, Strategist for DailyFX.com
To receive James Stanley’s analysis directly via email, please SIGN UP HERE
Contact and follow James on Twitter: @JStanleyFX


