


Talking Points:
- Gold Technical Strategy: Longer-term bearish, intermediate-term bullish, short-term mixed.
- Gold prices caught support off of a key Fib level, but sellers have yet to relent.
- If you’re looking for trading ideas, check out our Trading Guides. And if you’re looking for ideas that are more short-term in nature, please check out our IG Client Sentiment Indicator.
To receive James Stanley’s analysis directly via email, please SIGN UP HERE
In our last article, we looked at the recent up-trend in Gold prices running within a fairly consistent bullish trend channel. But this was just a part of the story, as the backdrop in Gold prices ahead of that bullish run was considerably bearish after price action had driven from a high above $1,295 down to a new low below $1,215.
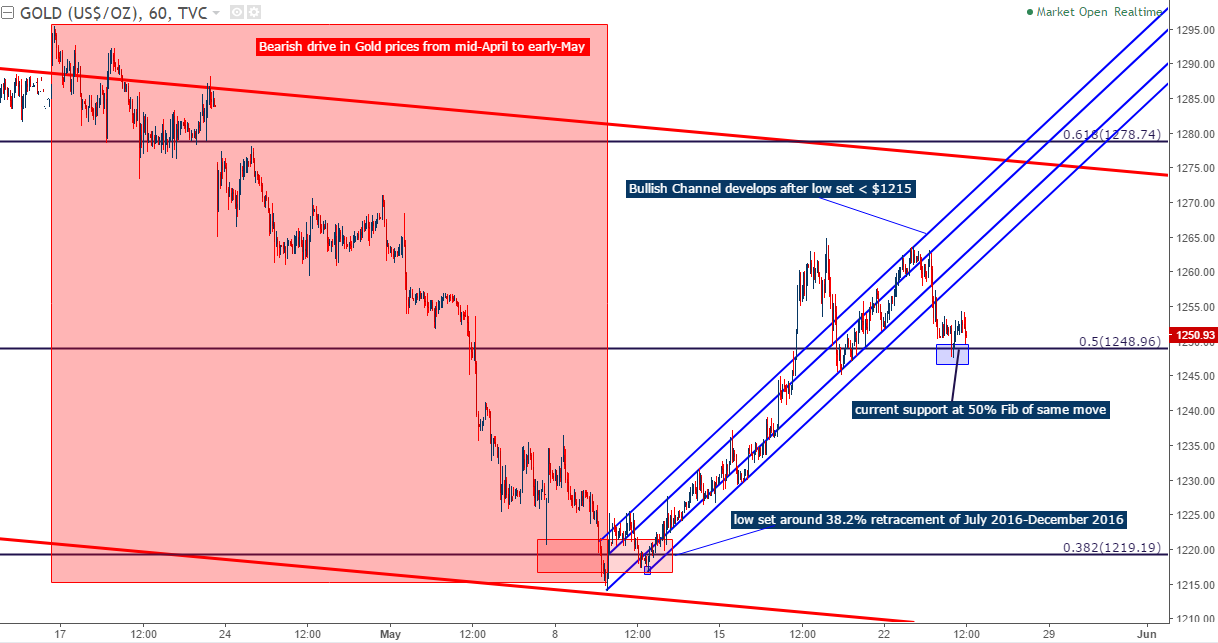
Chart prepared by James Stanley
Even the bearish move above needs to be taken in context, as this was coming fresh on the heels of another ‘rate hike rally’ that likely had some additional bullish drive on the basis of risk aversion. After the Fed hiked rates in December, Gold prices set a low around $1,122 before going on to rally for the next two months. Prices pulled back in the first half of March as the Federal Reserve furnished a plethora of warnings about impending rate hikes; but after rates were actually hiked, Gold prices set another ‘higher-low’ before going on to rally for another month. This brought upon a test of a key trend-line that can be found by connecting the July high to the election night spike in Gold prices.
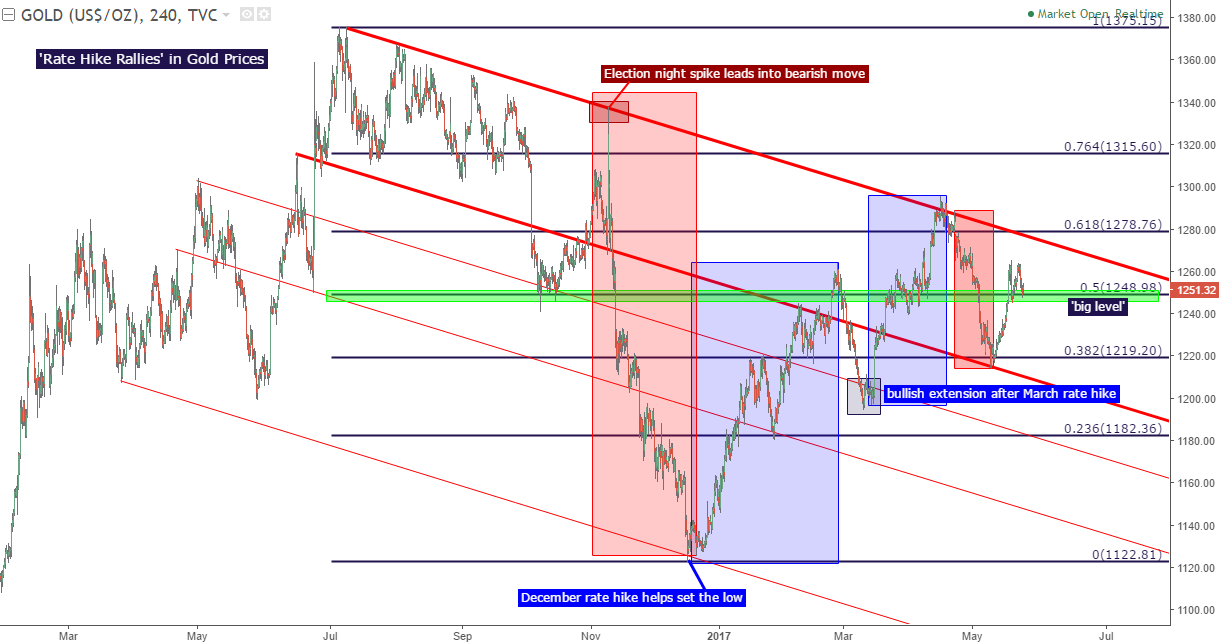
Chart prepared by James Stanley
The two above themes put Gold prices in a fairly precarious position at the moment. The longer-term formation is still bearish, but near-term, there are still some bullish tendencies here as support continues to show around the 50% Fibonacci retracement of that most recent major move. So, for those looking to trade shorter-term strategies, the bullish side would likely be most attractive using the support that came-in around the 50% retracement as a basis for risk placement. And for those that want to treat the bullish side with a bit more caution, adding a Fibonacci retracement on the most recent bearish move lower, from the $1,295-high down to the $1,214-low, can help to time the setup. The 50% retracement of that shorter-term move comes in at $1,254.80; and if prices can re-cross above this level, the prospect of bullish continuation will look considerably more attractive.
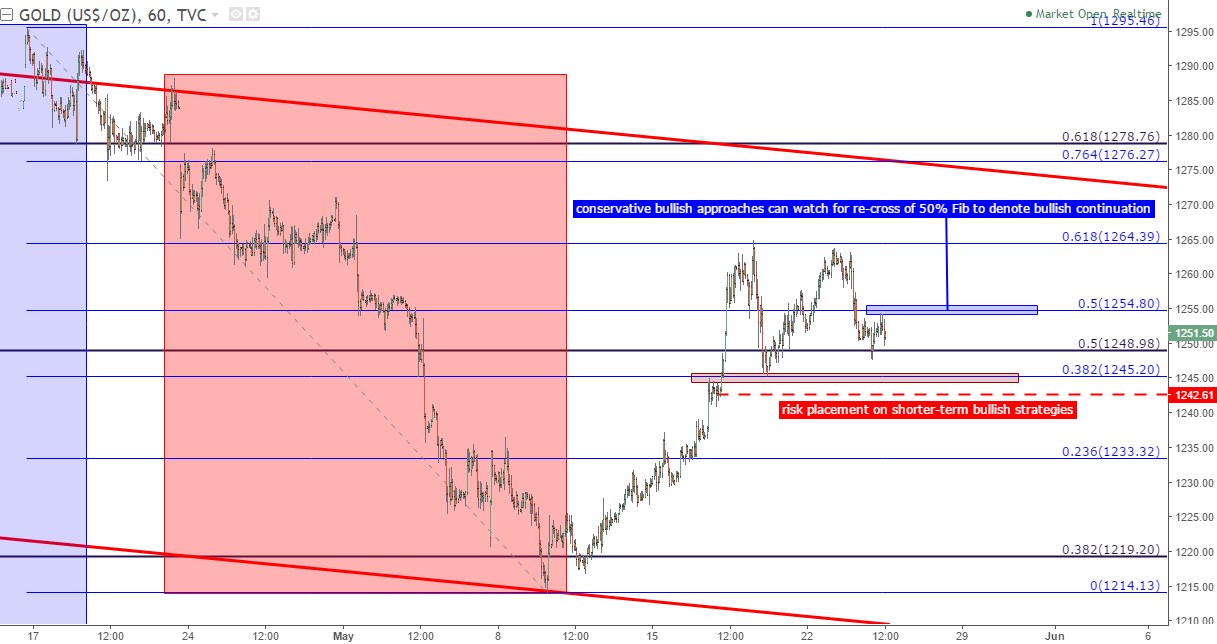
Chart prepared by James Stanley
Alternatively, longer time frames will likely want to avoid the bullish side, at least for now, as price action was unable to set a higher-high when re-testing $1,264. After support came-in around $1,249 earlier this morning, bulls were able to drive prices-higher; but sellers re-emerged just shy of the 50% Fib retracement of the shorter-term bearish move. This gives the appearance that sellers were merely using this morning’s support bounce to further position-in to bearish setups; and this further adds proof to the idea that we may be near another turn in Gold prices.
On the bearish side, there are a couple of ways that traders could move forward with current levels. A break below $1,245.20 would give us a ‘lower swing low’, and this could highlight the prospect of bearish continuation. If a fresh low prints, current support around $1,249 could be re-assigned as ‘lower-high’ resistance in the effort of bearish continuation. The second method would be to wait for another re-test of swing-high resistance around $1,254. Another re-test of this zone coupled with a short-term ‘lower-high’ could open the door to short-side swing setups.
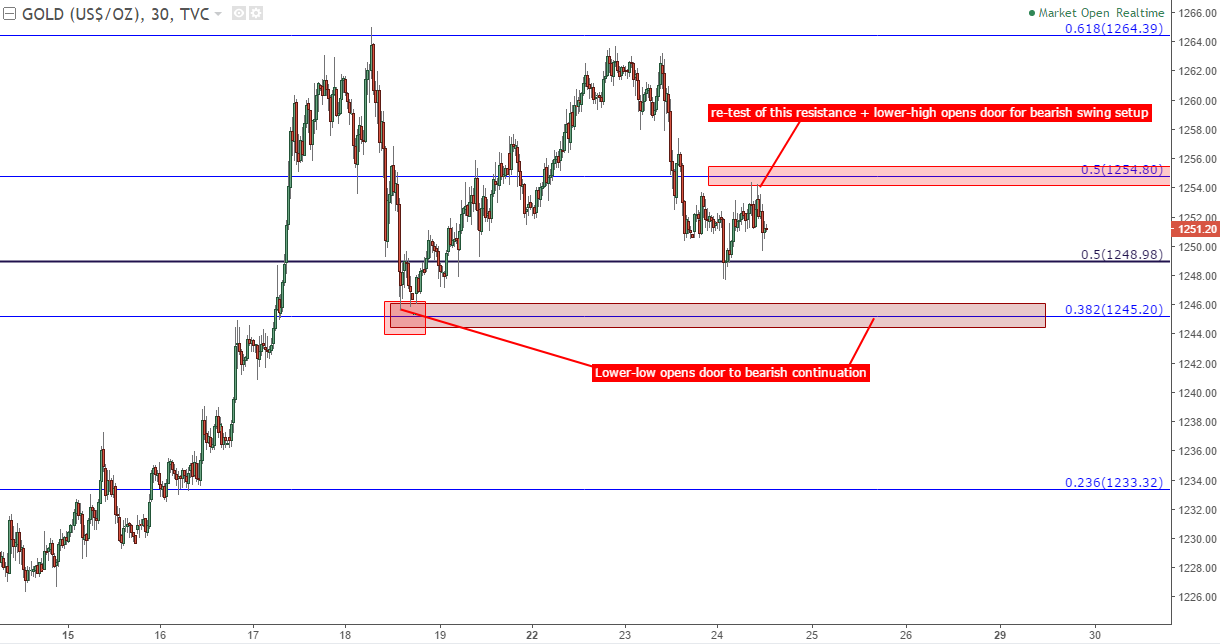
Chart prepared by James Stanley
--- Written by James Stanley, Strategist for DailyFX.com
To receive James Stanley’s analysis directly via email, please SIGN UP HERE
Contact and follow James on Twitter: @JStanleyFX


