


Talking Points:
- Gold prices have continued their bullish advance after higher-low support showed at $1,245.
- Last week’s pullback found support around the bottom of a bullish trend channel, and price action has since begun to climb-higher within the channel.
- If you’re looking for trading ideas, check out our Trading Guides. They’re free and updated for Q1, 2017. If you’re looking for ideas more short-term in nature, please check out our IG Client Sentiment.
To receive James Stanley’s Analysis directly via email, please sign up here.
In our last article, we looked at the continued bullish advance in Gold prices; and in the article before that we looked at a bullish trend-channel that had formed as Gold prices rallied off of their lows. At the time of our most recent publishing, the rally in Gold had gotten a bit ahead of itself as price action had traded well-above that bullish trend-channel. This led-in to a pullback on Thursday of last week that saw prices shed almost a full $20; but buyers stepped in near the support side of our bullish trend channel, and since then prices have been crawling-higher.

Chart prepared by James Stanley
For short and intermediate-term approaches, this channel can be usable in the effort of trading bullish trend continuation. A retest of the support side of the channel can open the door to bullish trend-side entries; and traders can look to prior swing low(s) at $1,251.50, $1,247.90 or $1,245.70 depending on how aggressively they wanted to treat the move.

Chart prepared by James Stanley
For longer-term perspectives, traders would likely want to avoid chasing the bullish side of Gold at the moment. More interesting on longer time frames is the bearish trend-channel that currently projects to the $1,275 range in Gold prices. Should resistance show on the daily chart at or below this level, the longer-term bearish formation could become usable again.
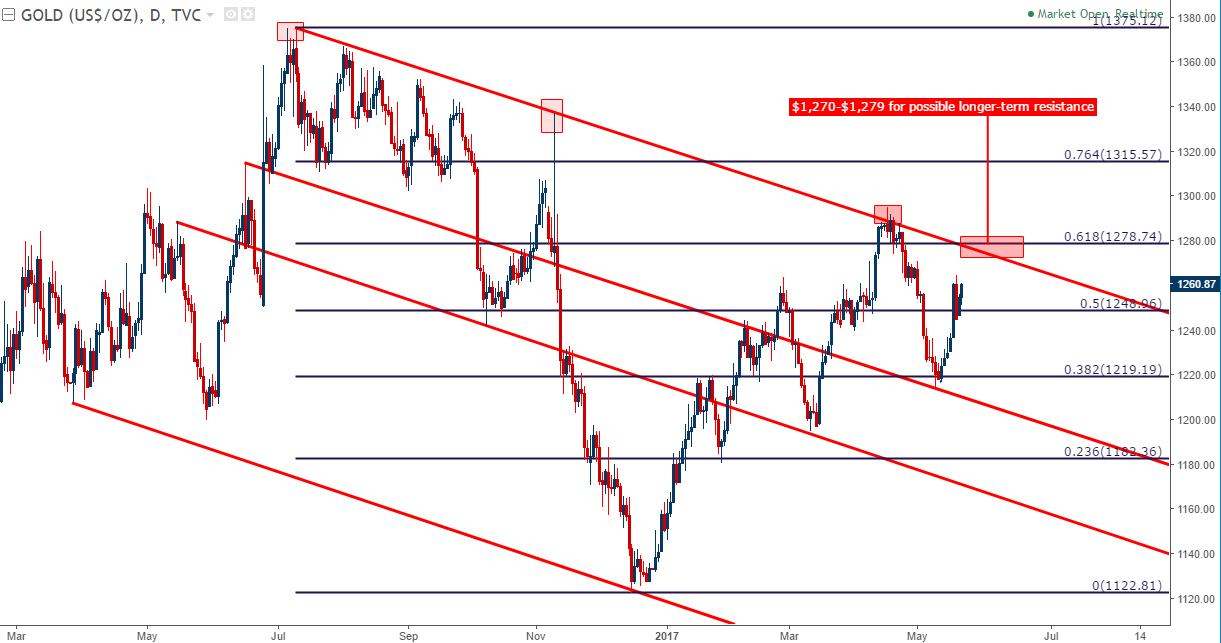
Chart prepared by James Stanley
--- Written by James Stanley, Strategist for DailyFX.com
To receive James Stanley’s analysis directly via email, please SIGN UP HERE
Contact and follow James on Twitter: @JStanleyFX


