


Talking Points:
- Gold prices have hastened the bullish advance, posing a topside break of the bullish trend channel we looked at on Monday.
- Near-term price action in Gold prices is definitely bullish; but a longer-term bearish channel persists.
- If you’re looking for trading ideas, check out our Trading Guides. They’re free and updated for Q1, 2017. If you’re looking for ideas more short-term in nature, please check out our IG Client Sentiment.
To receive James Stanley’s Analysis directly via email, please sign up here.
In our last article, we looked at the bullish channel that had begun to build with near-term price action in Gold prices. But given the veracity of the prior move-lower, that up-ward sloping channel took on the appearance of a bear-flag that could have down-side continuation potential provided that some element of resistance showed up.
Since then, not much resistance has shown: Buyers have rampantly pushed prices beyond any potential resistance levels with a minimum of pullback, and now short-term price action has burst above the bullish trend channel as the move has recently become rather one-sided.
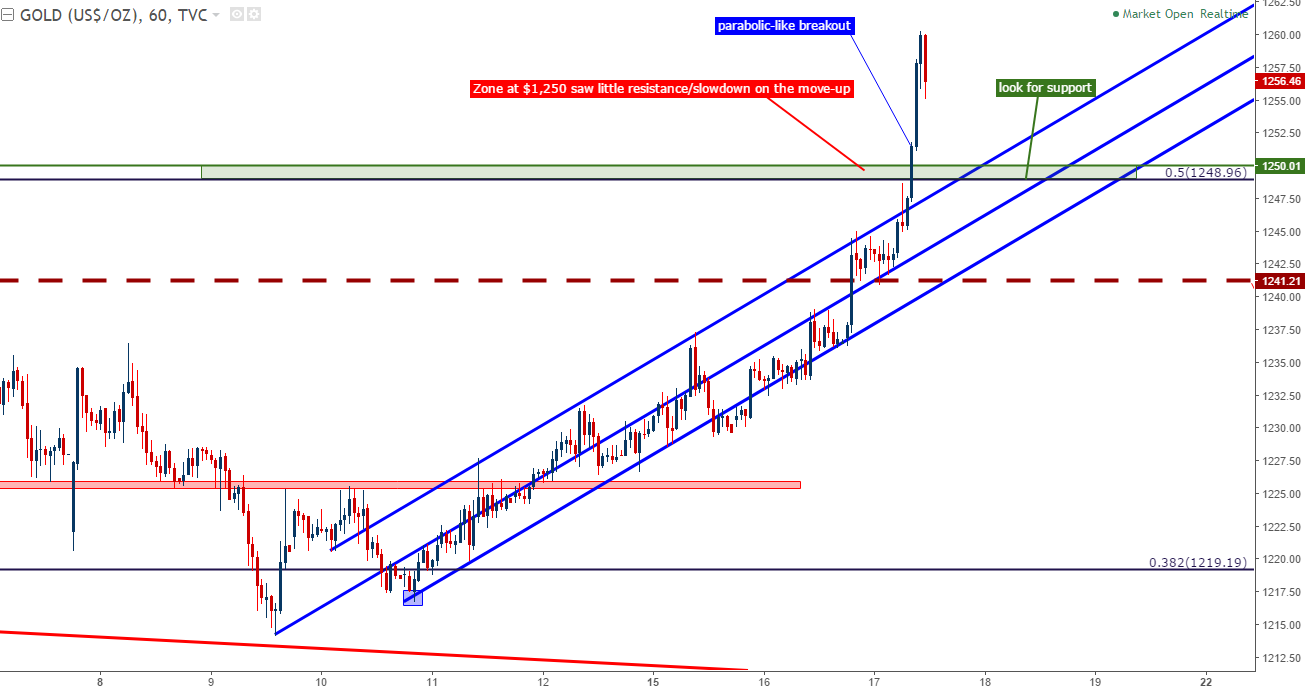
Chart prepared by James Stanley
The swing-low from last week developed at an interesting area – around the 38.2% of the prior major move, taking the July 2016 high down to the December low. This zone is confluent with a trend-line as part of a bearish channel over the same period of time.
The momentum in this move is very similar to what was seen in the post-rate hike backdrop over the past seven months. After the Fed hiked rates in December, Gold prices went on a bullish rampage for the next two-and-a-half months. Then in early-March, that up-trend cooled as the Fed talked up the prospect of a March rate hike. But after that March rate hike, Gold prices were free to fly again, as bulls took over to push prices up to the $1,295 area. In mid-April, and hastened by the results from the first round of French elections, weakness began to show again in Gold prices until last week’s low came in. So, while near-term momentum is decidedly bullish, the intermediate-term formation here would still be bearish in nature, and this would remain as such until we either a) post a topside break out of the bearish channel or b) take out the prior swing-high at $1,295 (this would offer additional confirmation as a $1,295 print would necessitate a bullish channel break).
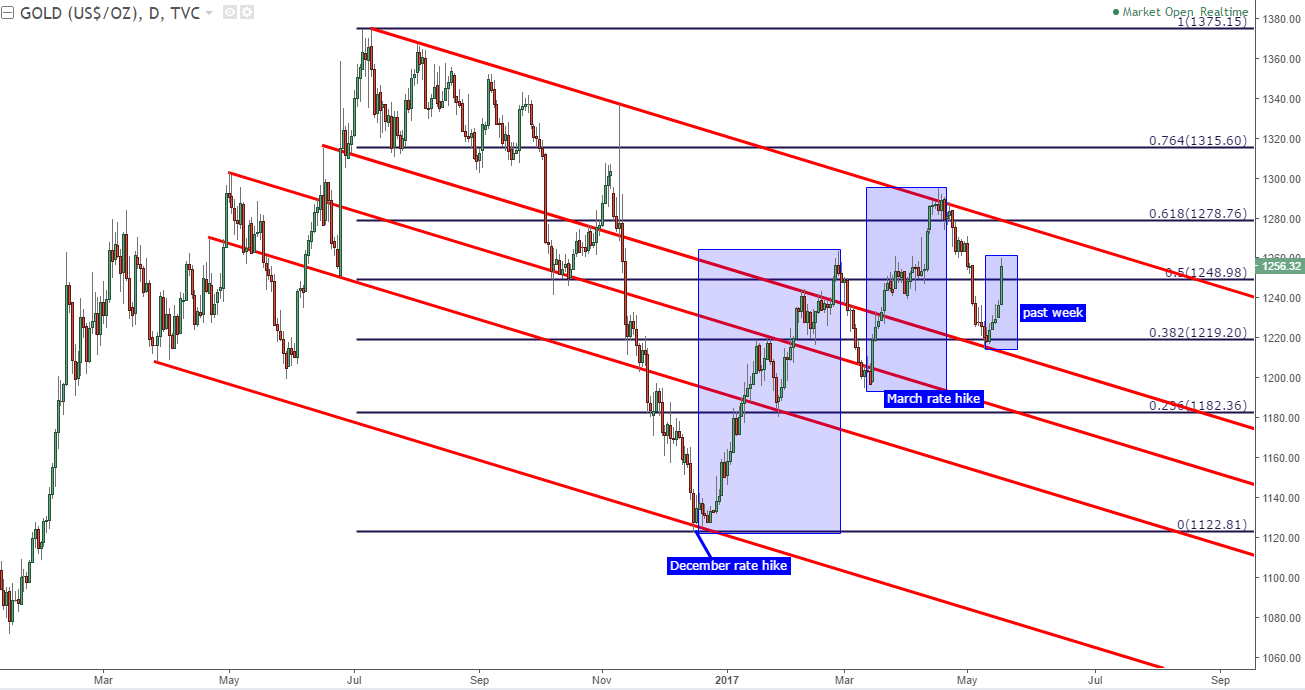
Chart prepared by James Stanley
The counter-active nature of short and long-term setups would allow traders to utilize their USD-biases for positioning into trades. For those that do want to look for continued USD-weakness, the short-term formation should be the focus of those efforts, and traders would likely want to wait for an element of support to show so that risk levels could be properly allocated.
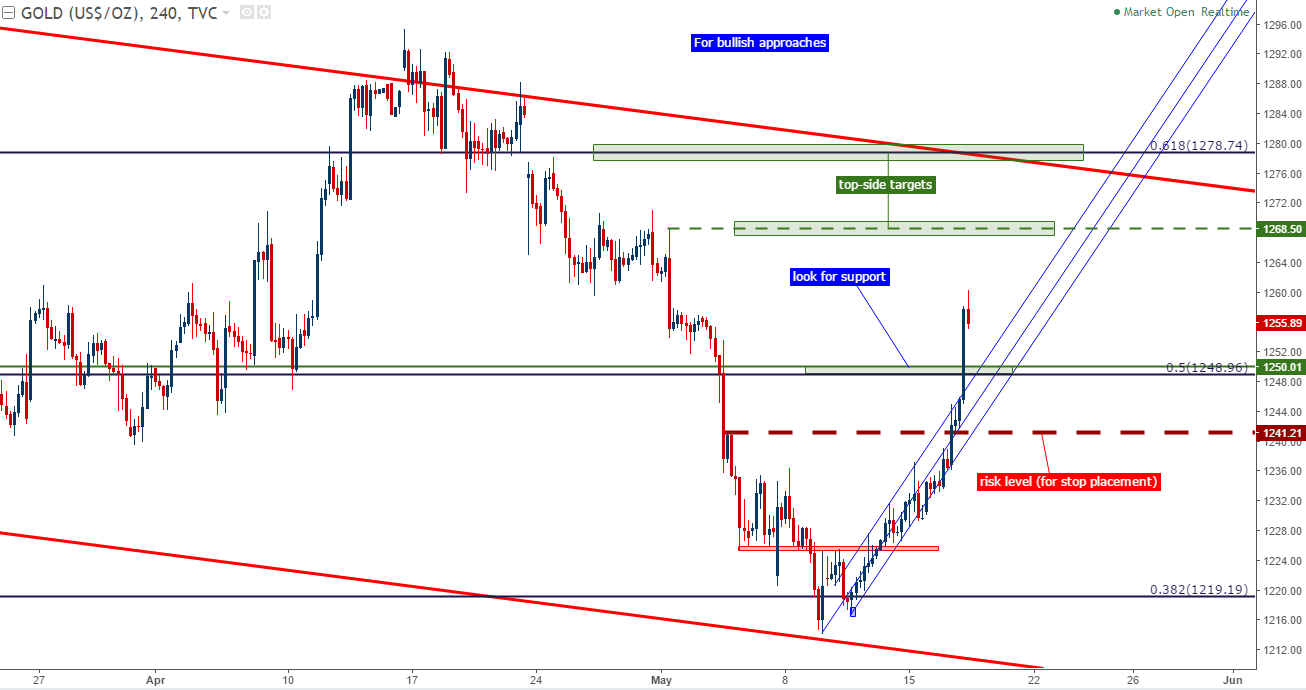
Chart prepared by James Stanley
For bearish approaches, traders would likely want to take heed to the degree of strength that’s shown in this bullish burst-higher in Gold prices. This isn’t the type of price action that traders should want to directly fade, at least without some type of additional thesis. But resistance levels looming above current prices could open the door to reversal plays should sellers actually show up. On the chart below, we’re looking at three different areas where this could potentially play out, and these levels are all taken from prior price action. The third zone of resistance comprises an approximate $2 range from $1,276.55-$1,278.76.
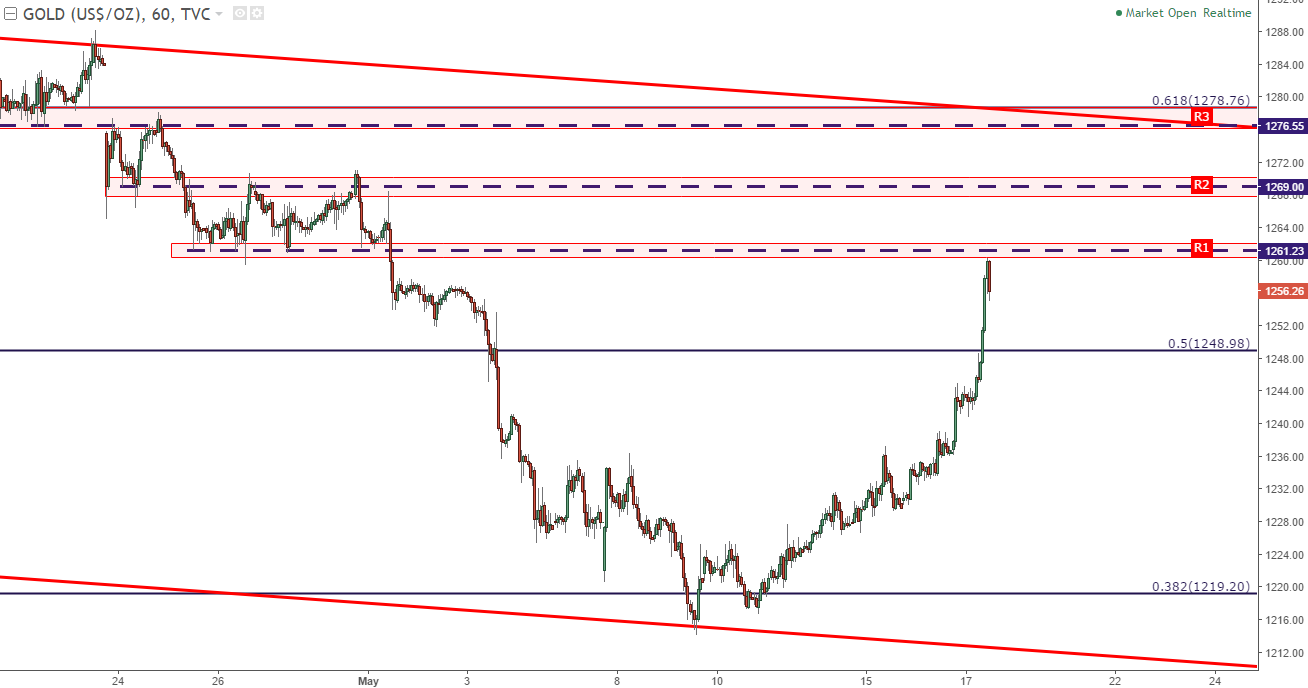
Chart prepared by James Stanley
--- Written by James Stanley, Strategist for DailyFX.com
To receive James Stanley’s analysis directly via email, please SIGN UP HERE
Contact and follow James on Twitter: @JStanleyFX


