


To receive James Stanley’s Analysis directly via email, please sign up here.
- Gold Technical Strategy: Near-term: Aggressively bearish, but finding support around $1,200.00.
- Gold prices have been aggressively bearish for most of March as U.S. rate hike odds have moved-higher.
- If you’re looking for trading ideas, check out our Trading Guides. If you’re looking for ideas more short-term in nature, please check out our Speculative Sentiment Index Indicator (SSI).
In our last article, we looked at the aggressively-bearish move in Gold prices that hit the yellow metal by more than $55 in a little over a week. The driver here was fairly-clear, as we saw expectations for a rate hike at the Federal Reserve’s March meeting shooting-higher after a chorus of Fed-speakers gave a series of hawkish comments that finally convinced markets that rate hikes were coming sooner-rather-than-later. This has produced a considerable hit to Gold prices with a major long-term level of support now coming into-play at the $1,200-area. This is the 38.2% Fibonacci retracement of the ‘big picture’ move in Gold prices, taking the Bretton Woods-fix of $35/oz all the way up to the 2011 high at $1,920.

Chart prepared by James Stanley
With support showing-up around this key level, we may be seeing the rate hike that’s largely-expected to take place later today being priced-in. So, the determinant to that next directional move in Gold prices is likely going to come from how hawkish or dovish the Fed might be with forward-looking rate expectations. Given that the Fed is using today’s meeting to roll-out ‘fan charts,’ which gives the bank a bit more flexibility in how they’re going to communicate those expectations to markets, with a ‘range’ of values being offered as opposed to a rigid, singular number.
The Fibonacci retracement drawn-around the most recent bullish move could be helpful for determining the next directional bias in Gold as we near this pivotal rate decision from the Fed. By taking the low set just after the Fed’s rate hike in December up to the high set in latter-February, and we can get a series of levels to work with. This is shown below with the royal blue Fibonacci retracement, and if price action is able to break-below the 50% marker of this move, bearish positions could be sought with traders attempting to sell ‘lower-high’ resistance. Conversely, on the bullish side of the pair, traders would likely want to let price action break above the prior swing-high, which is at the 38.2% retracement of that most recent bullish move before looking to press that theme.
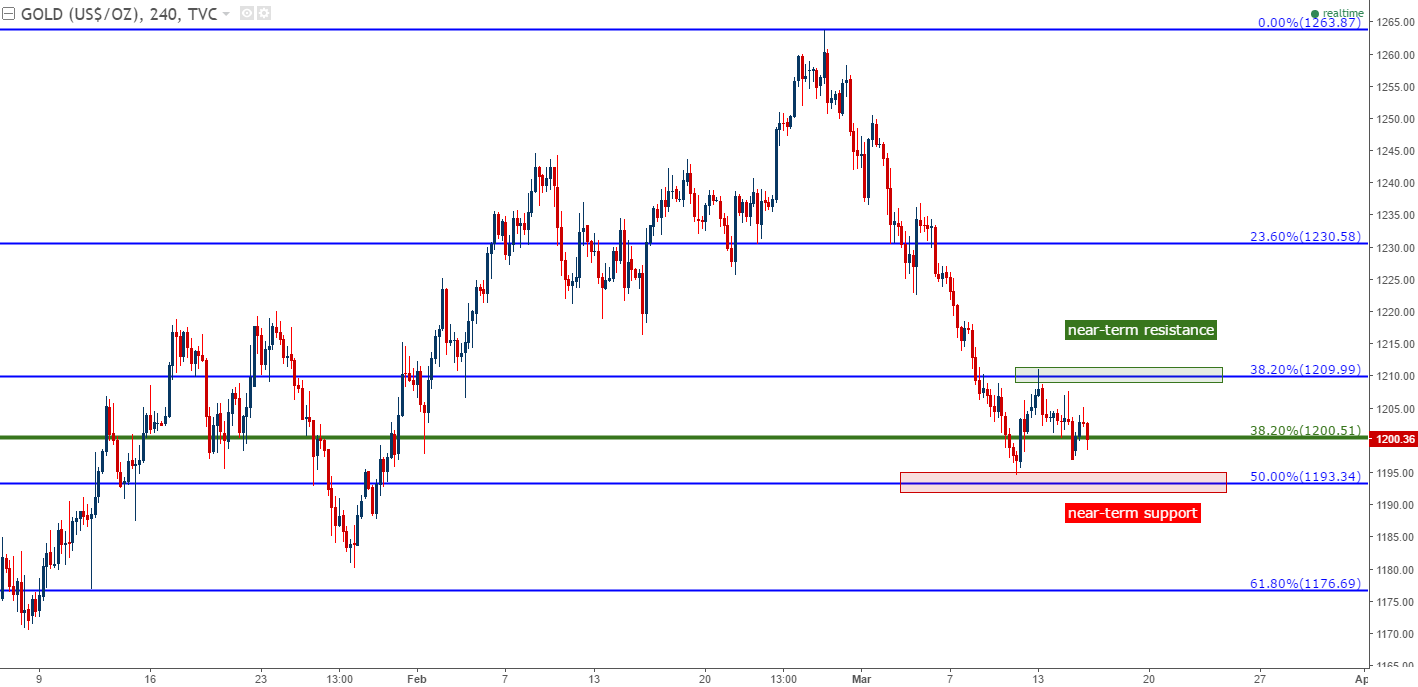
Chart prepared by James Stanley
--- Written by James Stanley, Strategist for DailyFX.com
To receive James Stanley’s analysis directly via email, please SIGN UP HERE
Contact and follow James on Twitter: @JStanleyFX


