


To receive James Stanley’s Analysis directly via email, please sign up here.
Talking Points:
- Gold Technical Strategy: Potential lower-high after strong burst higher on the heels of Friday’s NFP report.
- Gold is continuing to respect support/resistance levels produced by longer-term Fibonacci retracements.
- If you’re looking for trading ideas, check out our Trading Guides. And if you want something more short-term in nature, check out our SSI indicator.
In our last article, we looked at the precipitous fall in Gold prices on the back of a more hawkish Federal Reserve that spent much of the month of May talking up the prospect of higher rates in the United States. This prospect of higher rates was a huge change-of-pace for markets, which had built-in the expectation for the Fed to be extremely dovish after the risk-aversion that put up sizeable moves at the beginning of the year. And that inferred dovishness was hugely helpful to Gold prices, along with Equities and Commodities, as global markets appeared to be operating under the assumption that the Fed would do what they’ve been doing for the past six years by being dovish and passive with extremely loose monetary policy.
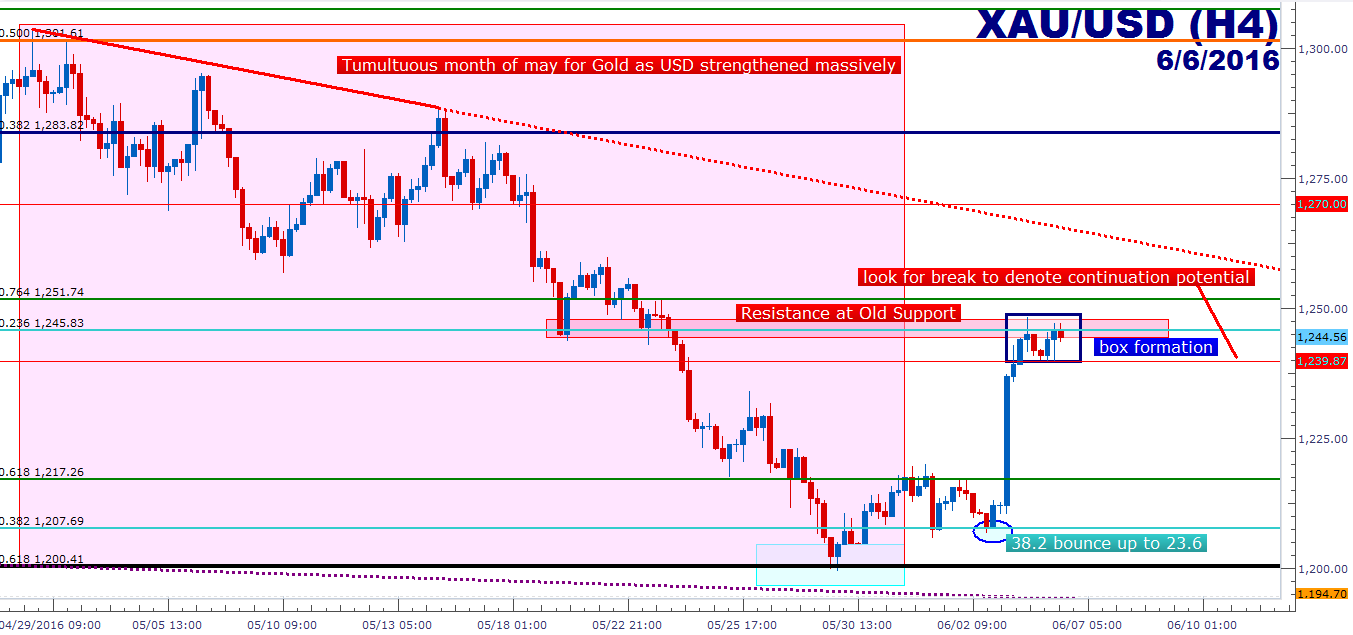
But that about-face in May brought on a huge change of pace to the US Dollar, and this had an enormous impact on Gold prices. After tagging the $1,301 resistance level in the early portion of the month, Gold prices fell all the way back to the $1,200.41 Fibonacci level, which is the 61.8% retracement of the 45-year move in Gold prices, taking the 1968 low of $34.95 to the 2011 high at $1,920.80. Coming into June, Gold was continuing to dwindle near support at $1,207.69, which is the 38.2% retracement of the most recent major move.
Friday’s NFP report provided a dose of cold water to those June rate hike expectations, as an abysmal print gave the appearance of a weaker US economy than initially hoped, and this brought in a significant bout of USD-weakness across the currency spectrum. Gold caught a significant bid, rallying all the way into a prior zone of support at $1,245.83, which is also the 23.6% retracement of the most recent major move, taking the January 2015 high to the December 2015 low.
Since running into that resistance, price action has built-in to a box formation on the 4-hour chart, and this can be used to further help traders looking to set up the short-side position. Traders can look for a quick break of near-term price action support to denote down-side continuation potential. Should this break take place, traders can then begin to look to trigger the short position by looking for a price action reversal at resistance around current support of ~ $1,240.
Created with Marketscope/Trading Station II; prepared by James Stanley
--- Written by James Stanley, Analyst for DailyFX.com
To receive James Stanley’s analysis directly via email, please SIGN UP HERE
Contact and follow James on Twitter: @JStanleyFX


