


To receive James Stanley’s Analysis directly via email, please sign up here.
Talking Points:
- Gold Technical Strategy: Previously long, all targets hit.
- Gold has broken up to another fresh high, catching current resistance off of our previous 3rd-level target at $1,301.61.
- If you’re looking for trading ideas, check out our Trading Guides. And if you want something more short-term in nature, check out our SSI indicator.
In our last article we looked for another top-side entry in the Gold market. As we had just printed an evening star formation on the daily chart while still remaining constrained within the prior area of congestion, it was likely wise to wait for support to become more confirmed before pressing another top-side entry. That support came in a bit deeper 24 hours later, and since then Gold has caught a major bid to break up to new highs; giving the appearance that the past 2.5 months of congestion may be giving way to a legitimate top-side breakout.
A large contributing factor to this recent run has been the aggressive moves of weakness in the US Dollar, and this has sent many major pairings flying higher (like GBP/USD, and even EUR/USD).
Now traders have the challenging prospect of looking for fresh top-side re-entries after Gold has staged yet another bullish breakout. And given the scope of extreme USD-weakness over the past week, and to a greater degree over the past three months, it would likely behoove the trader to wait for a more attractive entry while USD drops down to deeper and deeper support levels.
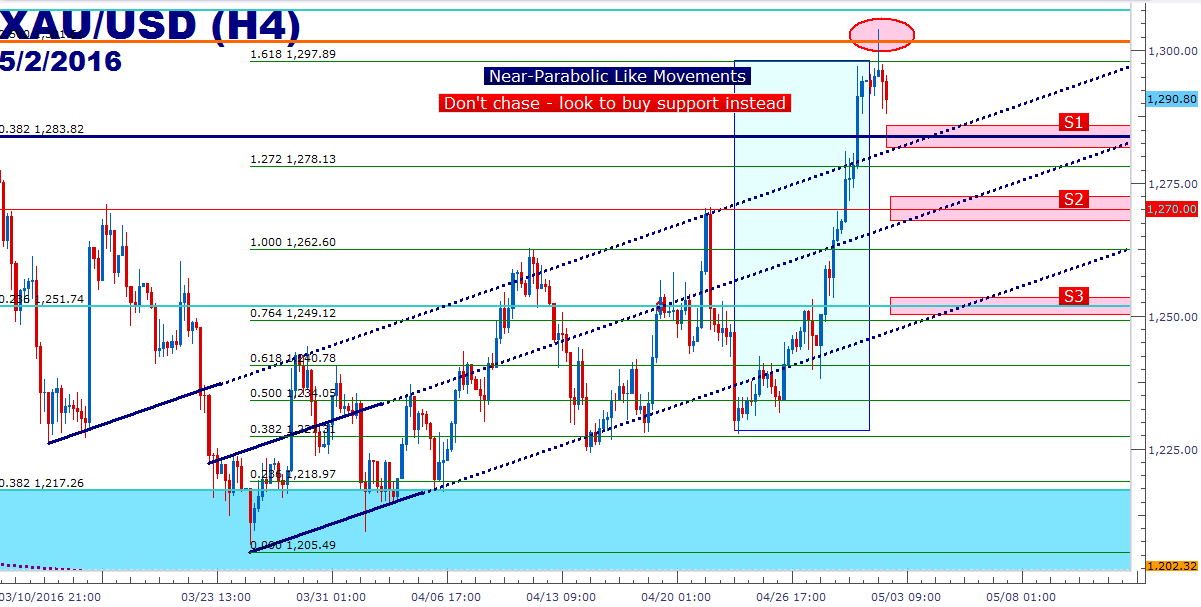
On the chart below, we look at three different support zones in Gold that could be helpful for plotting that re-entry. At $1,283.82, we have the 38.2% Fibonacci retracement of the ‘big picture’ move in Gold, and this is the level that had provided a clear swing high in March. A little deeper at $1,270, we have a very recent price action swing high that could become usable, and a little below that at $1,251.74 we have a well-tested level that was 23.6% of the prior major move.
Traders would want to wait for support to show at each of these intervals before triggering, and for those that want to avoid aggressive entries, the level at $1,270 would likely be optimal for that next long position given the more recent tests of resistance at this interval (swing high on 4/21/2016).
Targets for top-side entries can be cast towards prior levels of interest, with $1,283.82 becoming an active target for $1,270 entries or below; after which $1,301.61 becomes a secondary target, as this is the 50% Fibonacci retracement of the 2008-2011 move; followed by $1,307.49 (the 2015 high). If we eclipse that, we’d be looking at a 20-month high in the Gold market, at which point breakout trade management could be utilized on any remainder of the lot.
Created with Marketscope/Trading Station II; prepared by James Stanley
--- Written by James Stanley, Analyst for DailyFX.com
To receive James Stanley’s analysis directly via email, please SIGN UP HERE
Contact and follow James on Twitter: @JStanleyFX


