


Silver Price Outlook:
- Silver prices have slowly but surely rallying throughout May.
- Ongoing erosion in US real yields has increased precious metals’ appeal amid a weak US Dollar environment.
- Recent changes in sentiment suggest that silver prices have a mixed bias in the near-term.
Yields Down, Silver Up
The inflation narrative is changing, but the changes may be good for precious metals. As gold prices have rallied sharply in recent days, silver prices have been enjoying a slower but steady march higher throughout the month of May as well. Although May has typically been a rather bearish month for the precious metals complex, silver’s resiliency has been defined by a revitalized fundamental backdrop: US real yields are eroding alongside the US Dollar.

Silver Price, Volatility Relationship Normalizing
Both gold and silver are precious metals that typically enjoy a safe haven appeal during times of uncertainty in financial markets. While other asset classes don’t like increased volatility (signaling greater uncertainty around cash flows, dividends, coupon payments, etc.), precious metals tend to benefit from periods of higher volatility as uncertainty increases silver’s safe haven appeal.
VXSLV (SILVER VOLATILITY) TECHNICAL ANALYSIS: DAILY PRICE CHART (May 2020 to May 2021) (CHART 1)
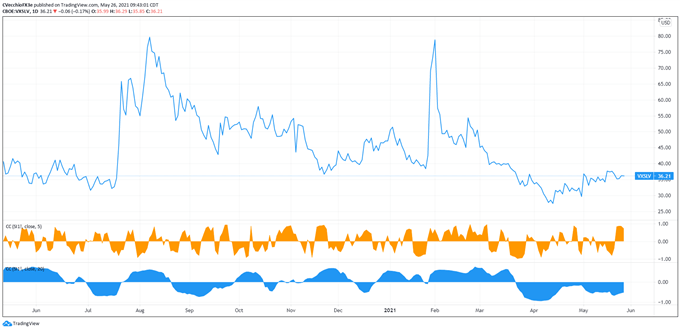
Silver volatility (as measured by the Cboe’s gold volatility ETF, VXSLV, which tracks the 1-month implied volatility of silver as derived from the SLV option chain) was trading at 36.21 at the time this report was written, still down from its May highs (which were two-month highs).. The 5-day correlation between VXSLV and silver prices is +0.60 and the 20-day correlation is -0.51. One week ago, on May 19, the 5-day correlation was -0.80 and the 20-day correlation was -0.63.
SILVER PRICE TECHNICAL ANALYSIS: DAILY CHART (March 2020 to May 2021) (CHART 2)
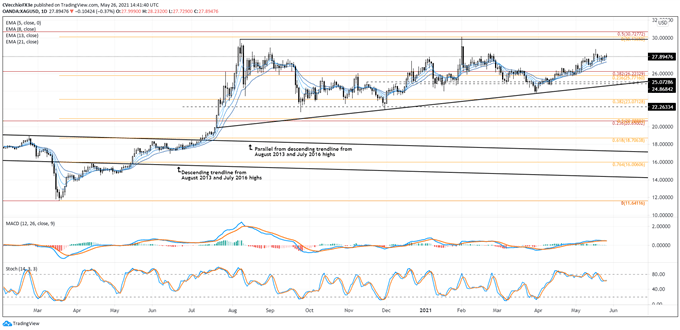
In the previous silver price forecast update, it was noted that “insofar as the downtrend has been broken, focus has shifted from a bearish double top to more stability within the sideways range in place since last summer, which in context of longer-term timeframes, suggests that a multi-month bull flag has been forming.” Silver prices have edged higher in this consolidation, which has taken on the shape resembling that of an ascending triangle.
Momentum has continued to improve in recent days, with silver prices above their daily 5-, 8-, 13-, and 21-EMA envelope, which is in bullish sequential order; the daily 21-EMA proved itself as support during pullbacks. Daily MACD remains trending higher while above its signal line, and daily Slow Stochastics have started to turn higher while above its median line. The slow, steady grind back to the yearly high near 30.000 seems plausible over the coming weeks.
SILVER PRICE TECHNICAL ANALYSIS: WEEKLY CHART (November 2010 to May 2021) (CHART 3)
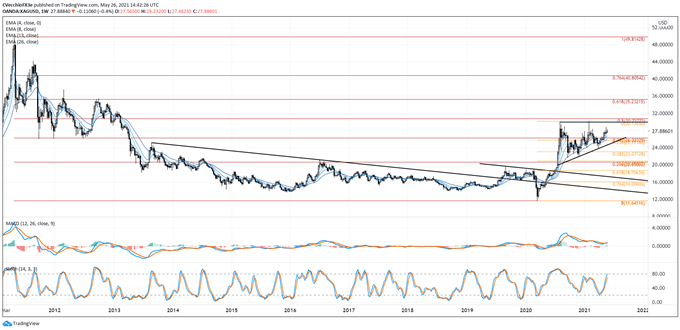
Silver prices are holding with their multi-month ascending triangle, remaining on track for a return to their yearly high at 30.1365. If accomplished, this would also constitute a potential longer-term bullish breakout, more evidence that a significant bottom has been carved out; the 2011 highs would need to be brought into consideration thereafter.

--- Written by Christopher Vecchio, CFA, Senior Currency Strategist


