


Gold Price and Silver Price, News and Chart
- Gold driving lower but long-term moving average may offer support.
- Silver collapses back to levels seen in 2009.
Gold – Will 200-DMA Provide Support?
Financial markets continue to be rocked and traditional correlations and asset status are being broken daily. Gold, one of the frontline safe-haven assets continues to be sold off despite the turmoil across the globe. A ‘dash-for-cash’ continues, leaving all asset classes vulnerable and gold is no exception. It remains to be seen if yesterday’s emergency Fed rate cut and liquidity measures will help to shore up the market, but as we stand there is no reason to enter any market, despite their lowly levels.
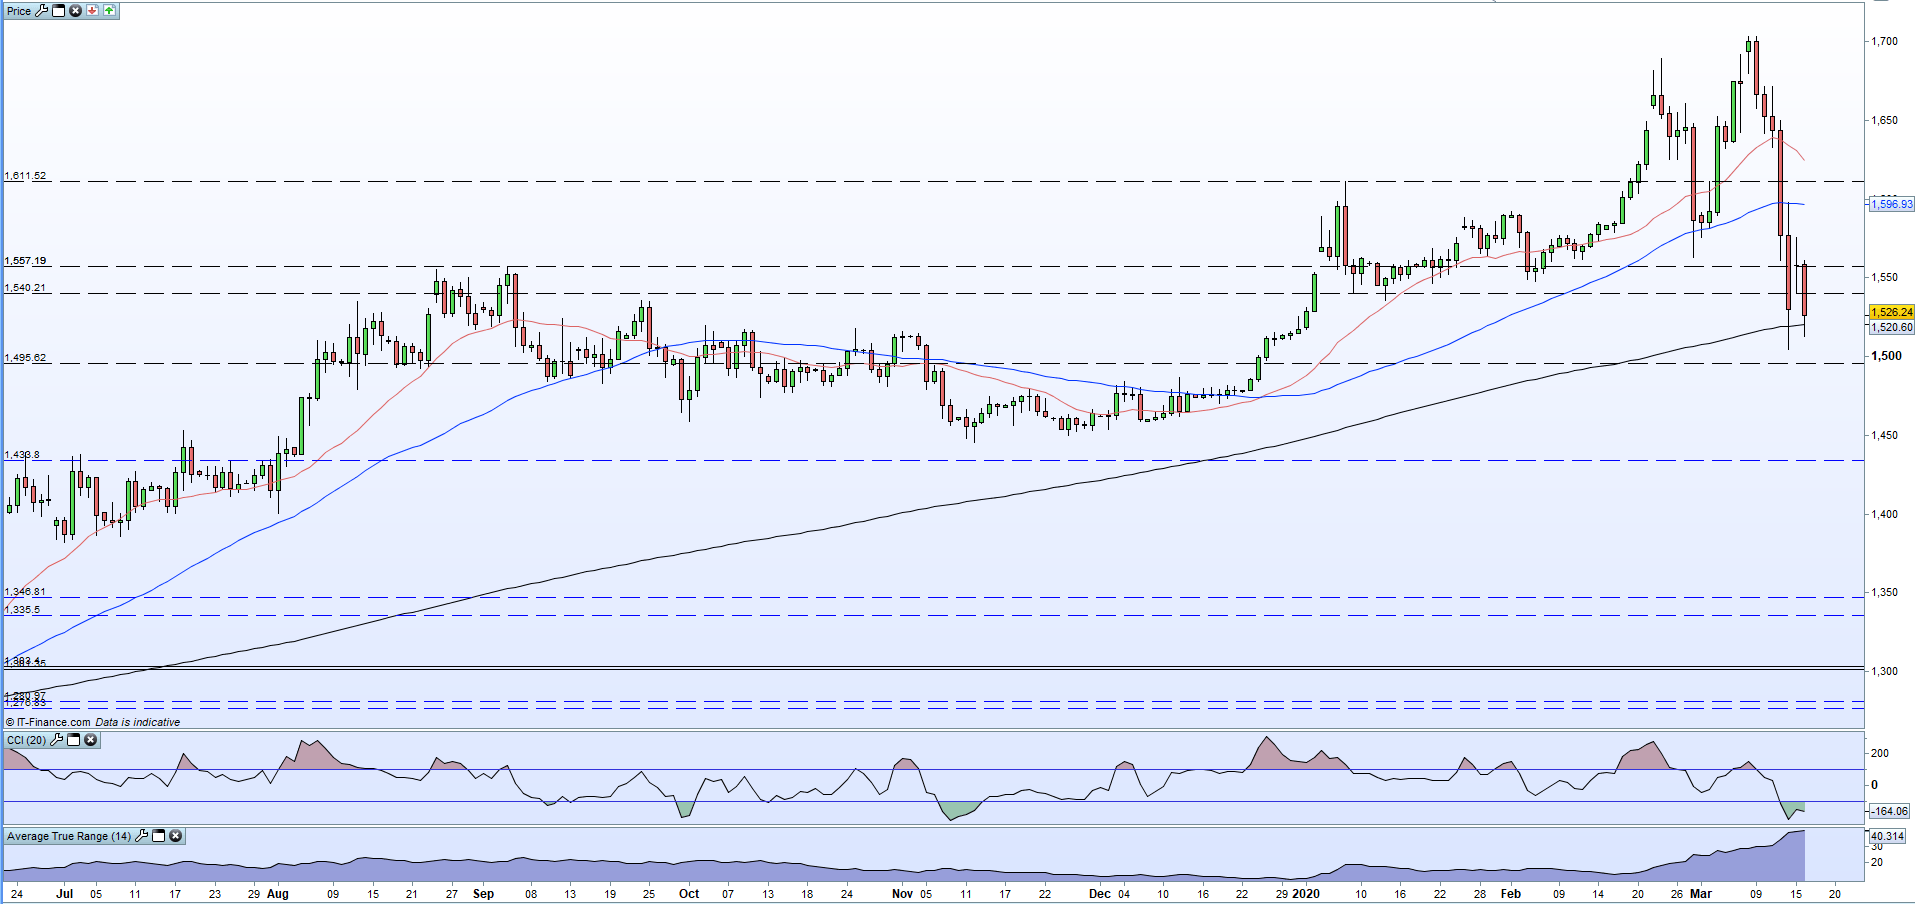
Gold has dropped through old horizontal support levels with ease and the only technical indicator that may help buttress the price is the 200-dma. Despite trading below this long-term indicator, gold has not closed below here and until it does the 200-dma may provide some support. The ATR indicator highlights the extreme volatility in the market while the CCI shows gold in oversold territory for the first time since mid-November.

Becoming a Better Trader – Principles of Risk Management (Videos)
Gold Daily Price Chart (June 2019 – March 16, 2020)

Silver Trades Through Decade Low
Silver currently trades at levels last seen in July 2009 after crashing through the December 2015/January 2016 double-low print around $13.65. Silver does not enjoy gold’s safe-haven appeal and today’s sell-off continues the pattern of the last three weeks after silver printed a multi-month high at $18.95. The chart remains pointed to the downside, although the CCI indicator shows it as heavily oversold, while the 50- and 200-dma are about to cross, forming a negative ‘death-cross’.
Silver Daily Price Chart (March 2019 – March 16, 2020)

Trading the Gold-Silver Ratio: Strategies and Tips
Traders may be interested in two of our trading guides – Traits of Successful Traders and Top Trading Lessons – while technical analysts are likely to be interested in our latest Elliott Wave Guide.
What is your view on Gold and Silver – bullish or bearish?? You can let us know via the form at the end of this piece or you can contact the author via Twitter @nickcawley1.


