


Gold Price & Silver Technical Highlights:
Gold working on a bull-flag breakout
As we are now officially kicking off a holiday week, actually two with New Years coming up, gold is trying to break above an important threshold. Not an ideal time for this to happen, but if it comes with some push then perhaps as the calendar flips to 2020 it will gain meaning.
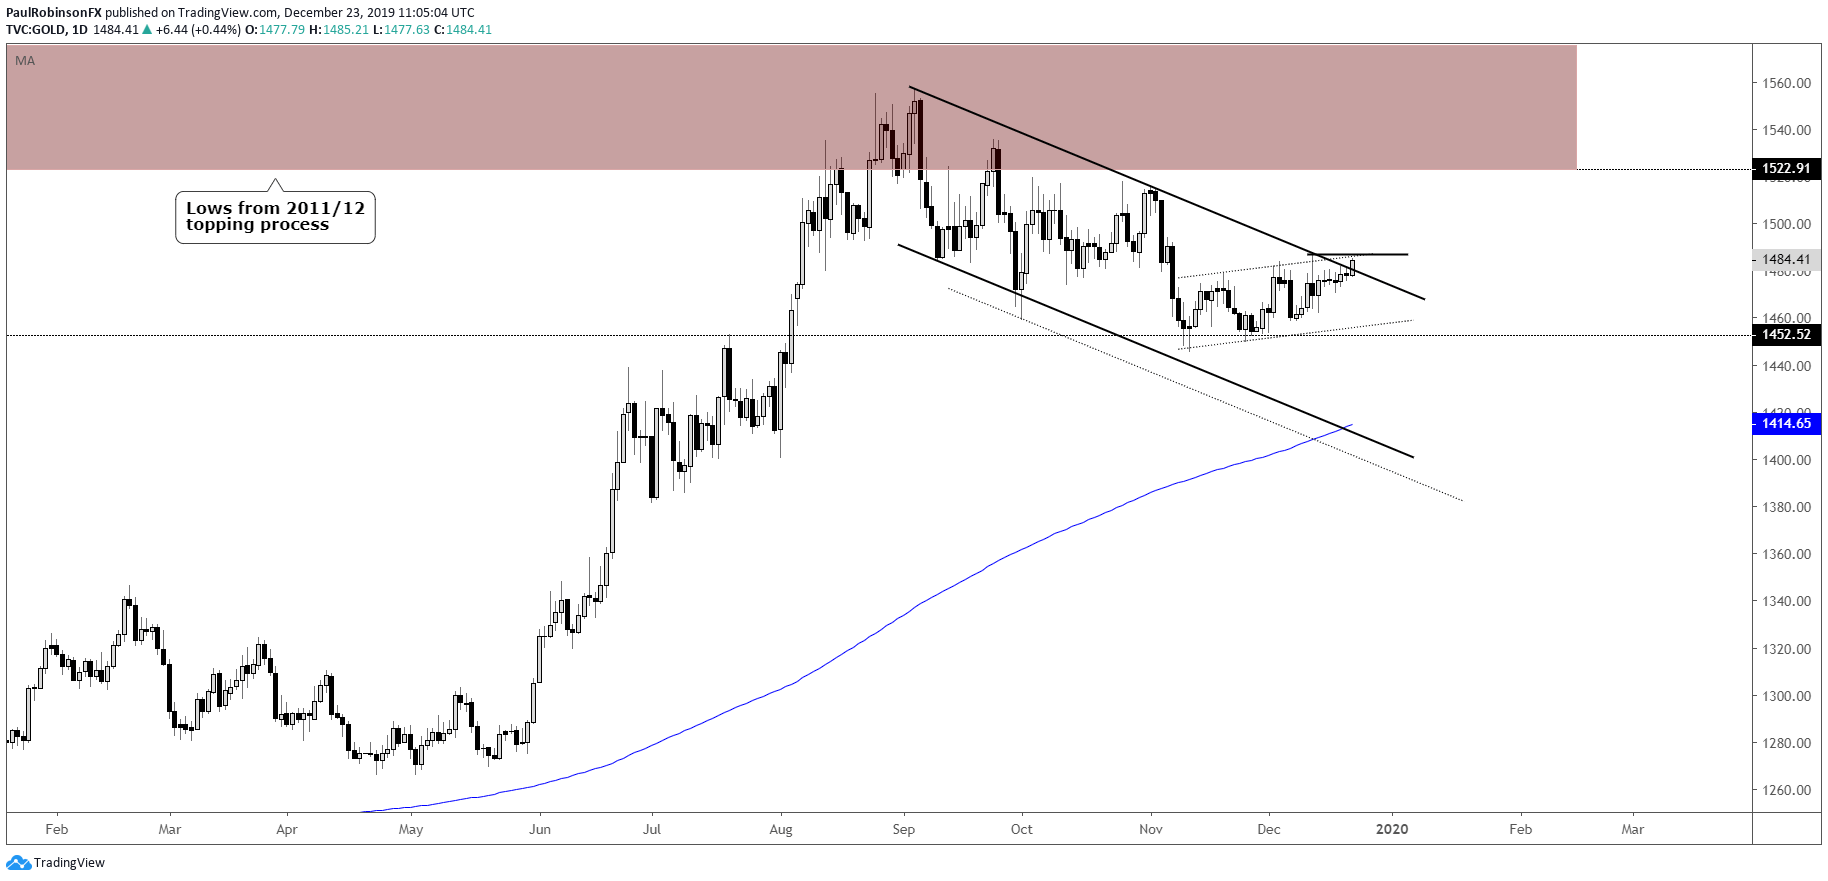
The threshold in question is the top-side trend-line of the bull-flag that began its development back after gold peaked in September. The construction of this bullish pattern has meant gold generally digested the rally from earlier in the year with the end result pointed towards a surge higher again.
Whether that is indeed beginning now or not, we shall see. For starters, today’s poke above the trend-line needs to also take price above 1487 and see price close firmly outside of the pattern, then further that along with a weekly close above too. So, there is work yet to be done.
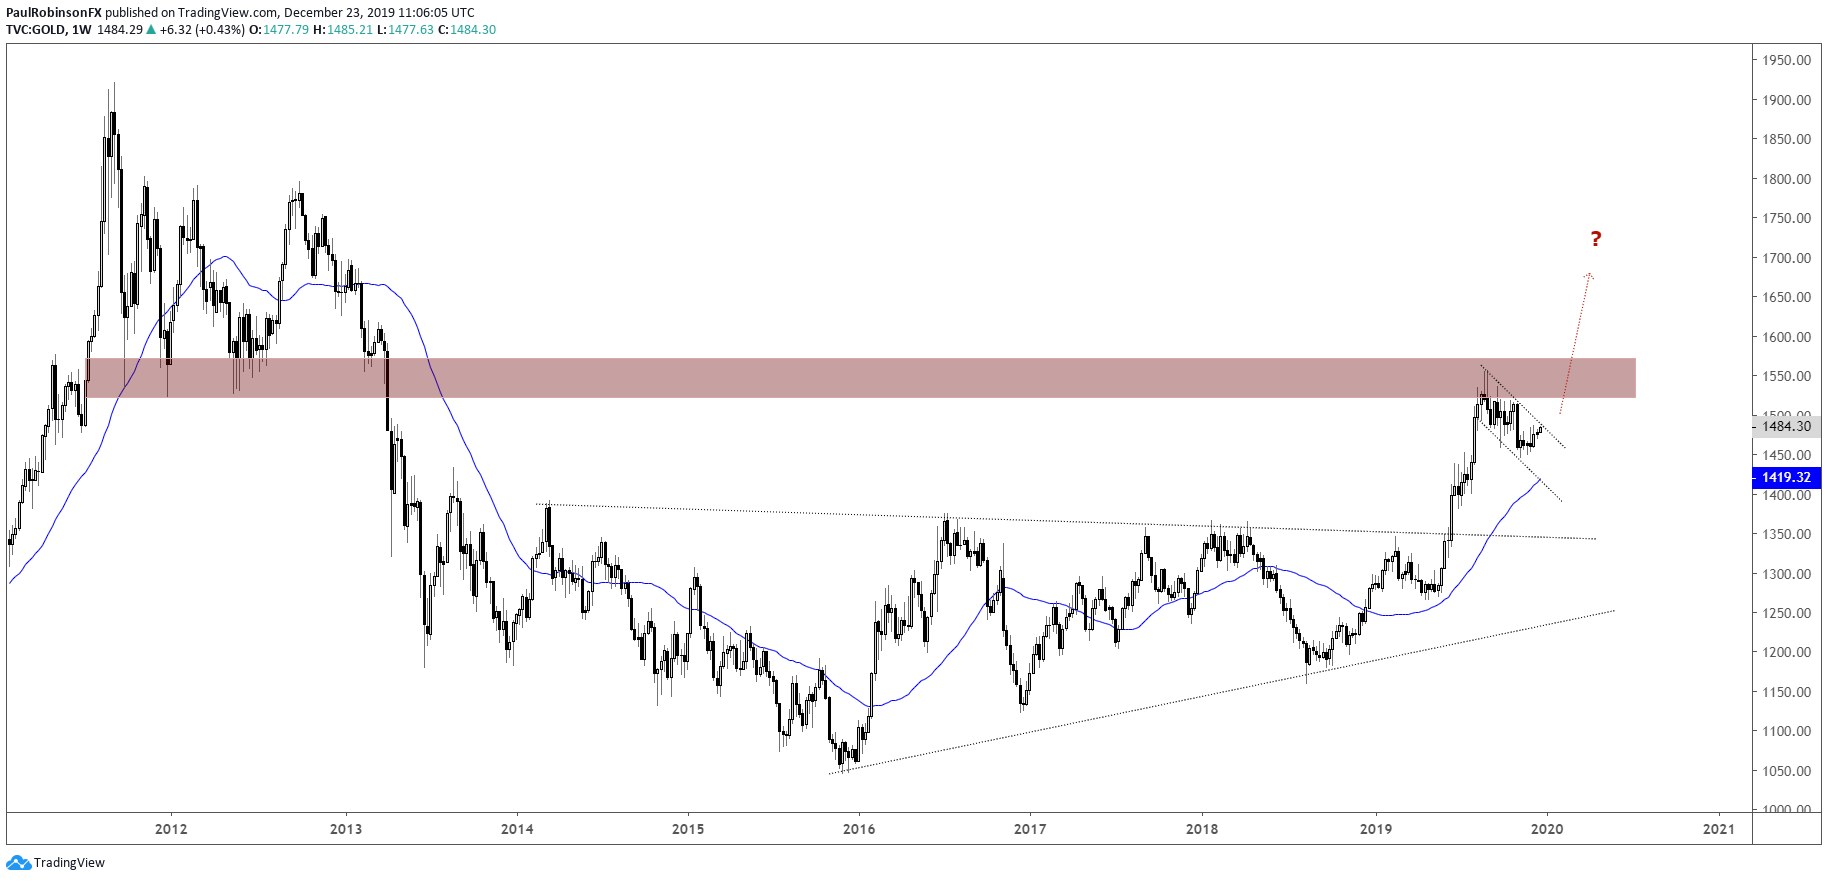
But if a breakout can hold, the 1522/1575 zone from the 2011/12 topping process will come into play. A break beyond 1575 could have gold rallying sharply higher in 2020.
Trading Forecasts and Educational Guides for traders of all experience levels can be found on the DailyFX Trading Guides page.
Gold Price Daily Chart (trying to cross top-side line of bull-flag)
Gold Weekly Chart (2011/12 zone of resistance is big)
Gold Price Charts by TradingView
Silver trying to cross confluence of resistance
So far this week silver is leading the way, and with the past couple of sessions helping push it above the September downtrend line and 17.01, we might be witnessing a breakout. The rally today will need to stay firm and ideally it will continue if the bullish scenario is to gain some traction. A fold back below resistance on a closing basis might constitute a rejection and will keep the tone remaining negative. Just as is the case with gold, it is most ideal if a breakout holds through a full weekly cycle.
Silver Daily Chart (crossing t-line, price resistance)

Silver Price Chart by TradingView
***Updates will be provided on the above technical outlook in webinars held at 1030 GMT on Tuesday and Friday. If you are looking for ideas and feedback on how to improve your overall approach to trading, join me on Thursday each week for the Becoming a Better Trader webinar series.
Resources for Forex & CFD Traders
Whether you are a new or experienced trader, we have several resources available to help you; indicator for tracking trader sentiment, quarterly trading forecasts, analytical and educational webinars held daily, trading guides to help you improve trading performance, and one specifically for those who are new to forex.
---Written by Paul Robinson, Market Analyst
You can follow Paul on Twitter at @PaulRobinsonFX


