Silver Price Forecast Overview:
- Silver prices are struggling to build on the bull flag breakout from last week. Failure to gain traction on the topside bull flag breakout has been apparent, having been rejected at the 61.8% retracement of the 2013 high/2015 low range at 18.007.
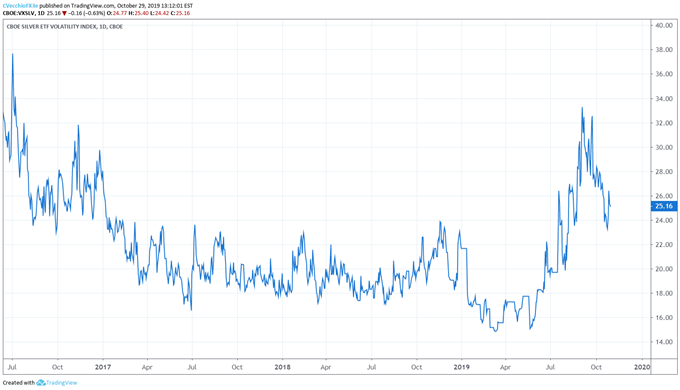
- Silver volatility has started to rebound after its sharp contraction in recent weeks, having lost nearly one-third of its value since early-September. The 5-day correlation between VXSLV and silver prices is 0.97 and the 20-day correlation is 0.04.
- Recent changes in sentiment suggests that silver prices may struggle in the coming days.
Looking for longer-term forecasts on Gold and Silver prices? Check out the DailyFX Trading Guides.
More signs that global macro concerns are fading into the background are making for a difficult environment for precious metals. Silver prices, which appeared to be on the verge of a bull flag breakout last week – like their golden counterpart – are now struggling to gain topside traction. Thanks in part to rising sovereign bond yields (in particular, US Treasury yields), the relative appeal of gold and silver has eroded in recent days. Shifts across asset classes suggests that silver prices may continue to lose their luster in the near-term, bringing into question the longer-term bullish bottoming effort.
Silver Prices Aligning with Silver Volatility Again
While other asset classes don’t like increased volatility (signaling greater uncertainty around cash flows, dividends, coupon payments, etc.), precious metals tend to benefit from periods of higher volatility as uncertainty increases gold’s and silver’s safe haven appeal. The opposite can be said during periods of falling volatility: gold and silver prices tend to suffer.
VXSLV (SILVER VOLATILITY) TECHNICAL ANALYSIS: DAILY PRICE CHART (JUNE 2016 TO OCTOBER2019) (CHART 1)

Silver volatility (as measured by the Cboe’s gold volatility ETF, VXSLV, which tracks the 1-month implied volatility of gold as derived from the SLV option chain) has started to rebound after its sharp contraction in recent weeks, having lost nearly one-third of its value since early-September. VXSLV is currently trading at 25.31, down from a yearly high of 33.30 in September, which was its highest level since January 3, 2017.
The 5-day correlation between VXSLV and silver prices is 0.97 and the 20-day correlation is 0.04 (four weeks ago, on October 1, the 5-day correlation was 0.60 and the 20-day correlation was 0.86). The current 20-day correlation is recovering from its lowest point since May 2019, having briefly turned negative from October 24 to October 28.
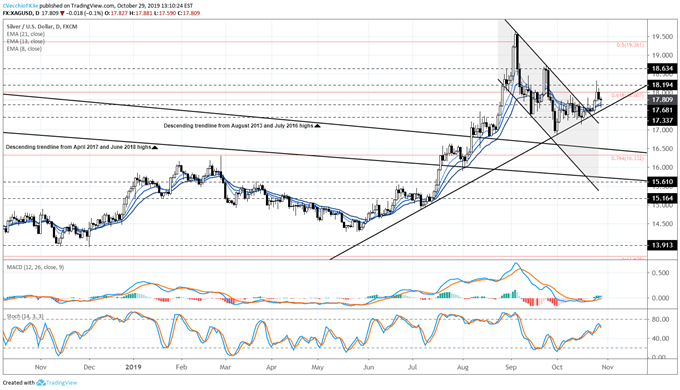
SILVER PRICE TECHNICAL ANALYSIS: DAILY CHART (SEPTEMBER 2018 TO OCTOBER 2019) (CHART 2)

In our most recent silver price technical forecast update, it was also noted that “silver prices may have just breached what could be considered resistance in the descending channel/bull flag pattern in place relative to the yearly highs set in September. But it’s not exactly a convincing break, given the lack of enthusiasm to the topside…If a bull flag breakout is indeed gathering pace, it still holds that a move above the October high at 17.937 is necessary confirmation.” Silver prices were last spotted at 17.809.
Failure to gain traction on the topside bull flag breakout has been apparent, having been rejected at the 61.8% retracement of the 2013 high/2015 low range at 18.007. Traders should keep an eye on the uptrend from the July and October swing lows over the coming days; failure to hold above said trend would be ominous for silver prices.
It thus still holds that the outlook is only cautiously bullish from a momentum perspective. Silver prices are above the daily 8-, 13-, and 21-EMA envelope, working on a daily hammer candle today. Daily MACD has started to rise back above the signal line, although Slow Stochastics have turned lower in bullish territory (albeit trending lower).
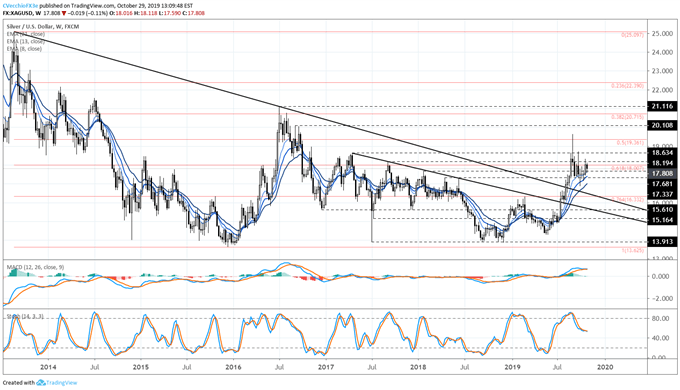
SILVER PRICE TECHNICAL ANALYSIS: WEEKLY CHART (AUGUST 2013 TO OCTOBER 2019) (CHART 3)

In our most recent silver price technical forecast update, it was also noted that “accordingly, if silver prices maintain their gains above the April and September 2017 highs, June 2018 swing highs, and the 2013 and 2016 swing highs, the longer-term bottoming effort remains valid. Opportunities to ‘buy the dip’ are still eyed now that silver prices have returned to their weekly 8-, 13-, and 21-EMA envelope.” Since the close on October 23, silver prices have added 1.6%.
The longer-term bullish momentum profile is weakening, however, as silver prices remain above their weekly 8-, 13-, and 21-EMA envelope. Weekly MACD has narrowed and is no longer issuing a bullish divergence (although it remains in bullish territory), and Slow Stochastics have continued to decline back towards its signal line. Tougher times may be ahead for silver prices, if not more consolidation.
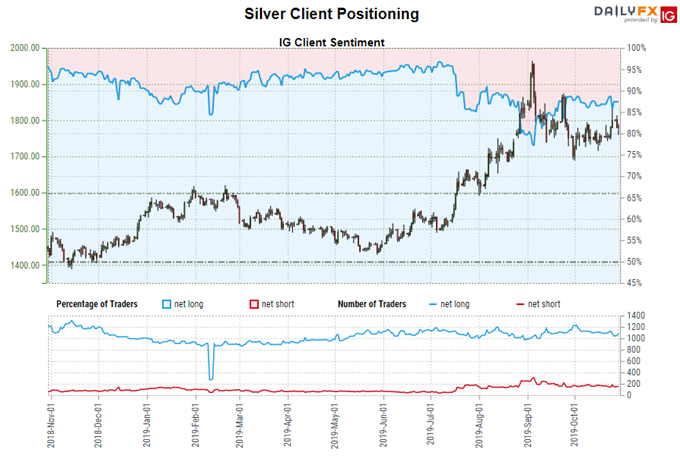
IG Client Sentiment Index: Spot Silver Price Forecast (OCTOBER 29, 2019) (Chart 4)

Spot silver: Retail trader data shows 89.8% of traders are net-long with the ratio of traders long to short at 8.84 to 1. The number of traders net-long is 4.1% higher than yesterday and 1.3% higher from last week, while the number of traders net-short is 26.5% lower than yesterday and 22.4% lower from last week.
We typically take a contrarian view to crowd sentiment, and the fact traders are net-long suggests spot silver prices may continue to fall. Traders are further net-long than yesterday and last week, and the combination of current sentiment and recent changes gives us a stronger spot silver-bearish contrarian trading bias.
FX TRADING RESOURCES
Whether you are a new or experienced trader, DailyFX has multiple resources available to help you: an indicator for monitoring trader sentiment; quarterly trading forecasts; analytical and educational webinars held daily; trading guides to help you improve trading performance, and even one for those who are new to FX trading.
--- Written by Christopher Vecchio, CFA, Senior Currency Strategist
To contact Christopher Vecchio, e-mail at cvecchio@dailyfx.com
Follow him on Twitter at @CVecchioFX
View our long-term forecasts with the DailyFX Trading Guides


