


Silver Price Forecast Overview:
- Silver volatility is running higher around the latest US-China trade war developments. VXSLV is currently trading at 29.25, down from a yearly high of 33.30 in September – its highest level since January 3, 2017.
- As silver prices continue to hold above the April 2017 and June 2018 swing highs, as well as the 2013 and 2016 swing highs, the longer-term bottoming effort remains valid.
- Recent changes in sentiment give us a mixed spot silver trading bias.
Looking for longer-term forecasts on Gold and Silver prices? Check out the DailyFX Trading Guides.
The start of October and Q4’19 has been kind to precious metals. After gold and silver prices came under sharp pressure as both September and Q3’19 came to a close, the redeployment of capital in an environment that has turned dark rather quickly has been favorably for precious metals.
Rising concerns around global growth thanks to terribly disappointing September PMIs, signs that the US-China trade war is set escalate again, and fears that the UK may end up with a no-deal, hard Brexit are proving to weigh heavily on risk appetite. If the current sentiment takes root, silver prices may stand to benefit in the coming sessions.
US TREASURY 10-YEAR YIELD TECHNICAL ANALYSIS: DAILY CHART (JUNE 2016 TO OCTOBER 2019) (CHART 1)
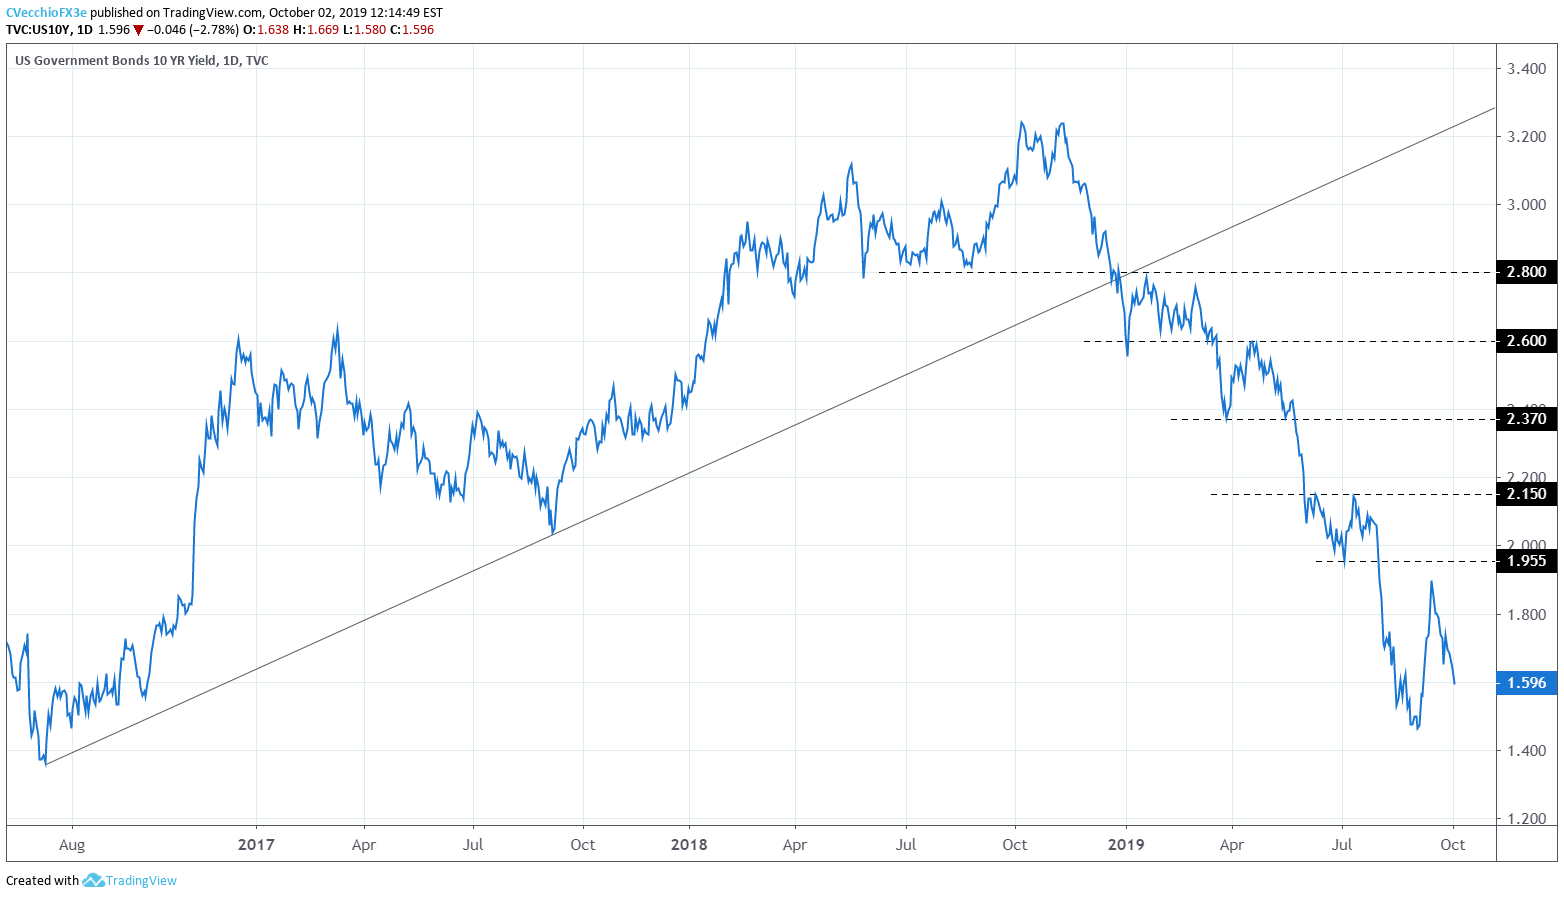
After hitting a yearly low and its lowest level since July 2016 on September 3 at 1.464%, the US Treasury 10-year yield rebounded sharply, hitting a high of 1.907% on September 13. Since then, however, interest rates have been on a straight line lower: at the time of writing, the US Treasury 10-year yield was at 1.596%.
Shiftsin US Treasury yields at the start of the new month and final quarter of the year are occurring in tandem with Fed funds futures and Eurodollar contracts showing higher odds of aggressive Fed rate cuts over the coming months. A week ago, markets were pricing in a 50% chance of a 25-bps rate cut at the October Fed meeting; now, those odds are closer to 75%.
WHY DO ‘REAL YIELDS’ MATTER TO SILVER PRICES?
The fall in US Treasury yields around rising growth concerns speaks to one of the most important fundamental underpinnings of precious metals’ rallies: environments that produce falling real yields tend to be the most bullish. On the other hand, environments that produce rising real yields tend to be the most bearish for precious metals.
Real yields are inflation-adjusted yields: in this case, the US Treasury 10-year yield minus the headline inflation rate. Why does this matter? Investing is all about asset allocation and risk-adjusted returns. On the asset allocation side, it’s about achieving required returns given the investor’s wants and needs.
If inflation expectations are rapidly increasing, you would expect to see fixed income underperform: the returns are fixed, after all. Why would you want to have a fixed return when prices are increasing? On a real basis, your returns would be lower than otherwise intended.
Rising US real yields means that the spread between Treasury yields and inflation rates isincreasing. If precious metals yield nothing (no dividends, coupons, or cash flows), they would be ill-suited to hold when US real yields rose; and vice-versa.
Silver Prices Follow Silver Volatility Back Higher
While other asset classes don’t like increased volatility (signaling greater uncertainty around cash flows, dividends, coupon payments, etc.), precious metals tend to benefit from periods of higher volatility as uncertainty increases gold’s and silver’s safe haven appeal.
VXSLV (SILVER VOLATILITY) TECHNICAL ANALYSIS: DAILY PRICE CHART (APRIL 2016 TO OCTOBER 2019) (CHART 2)

Silver volatility (as measured by the Cboe’s gold volatility ETF, VXSLV, which tracks the 1-month implied volatility of gold as derived from the SLV option chain) is running higher around the latest US-China trade war developments. VXSLV is currently trading at 29.25, down from a yearly high of 33.30 in September – its highest level since January 3, 2017.
The 5-day correlation between VXSLV and silver prices is 0.61 and the 20-day correlation is 0.83 (one month ago, on September 4, the 5-day correlation was 0.89 and the 20-day correlation was 0.87). While the relationship between silver prices and silver volatility has weakened in recent days, the longer-term relationship still holds: a market environment defined by higher silver volatility may help provide support for silver prices moving forward.
SILVER PRICE TECHNICAL ANALYSIS: WEEKLY CHART (AUGUST 2013 TO OCTOBER 2019) (CHART 3)

In our most recent silver price technical forecast update, it was noted that “silver prices may be due for a period of sideways consolidation if the longer-term bottoming effort is to remain valid.” At the time the note was written, silver prices were trading at 18.094; now, they are trading at 17.581. It now stands to reason that the pullback in silver prices may be coming to an end; thus far, on the weekly timeframe, a bullish hammer is forming. As silver prices continue to hold above the April 2017, September 2017, and June 2018 swing highs, and the 2013 and 2016 swing highs, the longer-term bottoming effort remains valid. Opportunities to ‘buy the dip’ are still eyed.
SILVER PRICE TECHNICAL ANALYSIS: DAILY CHART (SEPTEMBER 2018 TO OCTOBER 2019) (CHART 4)
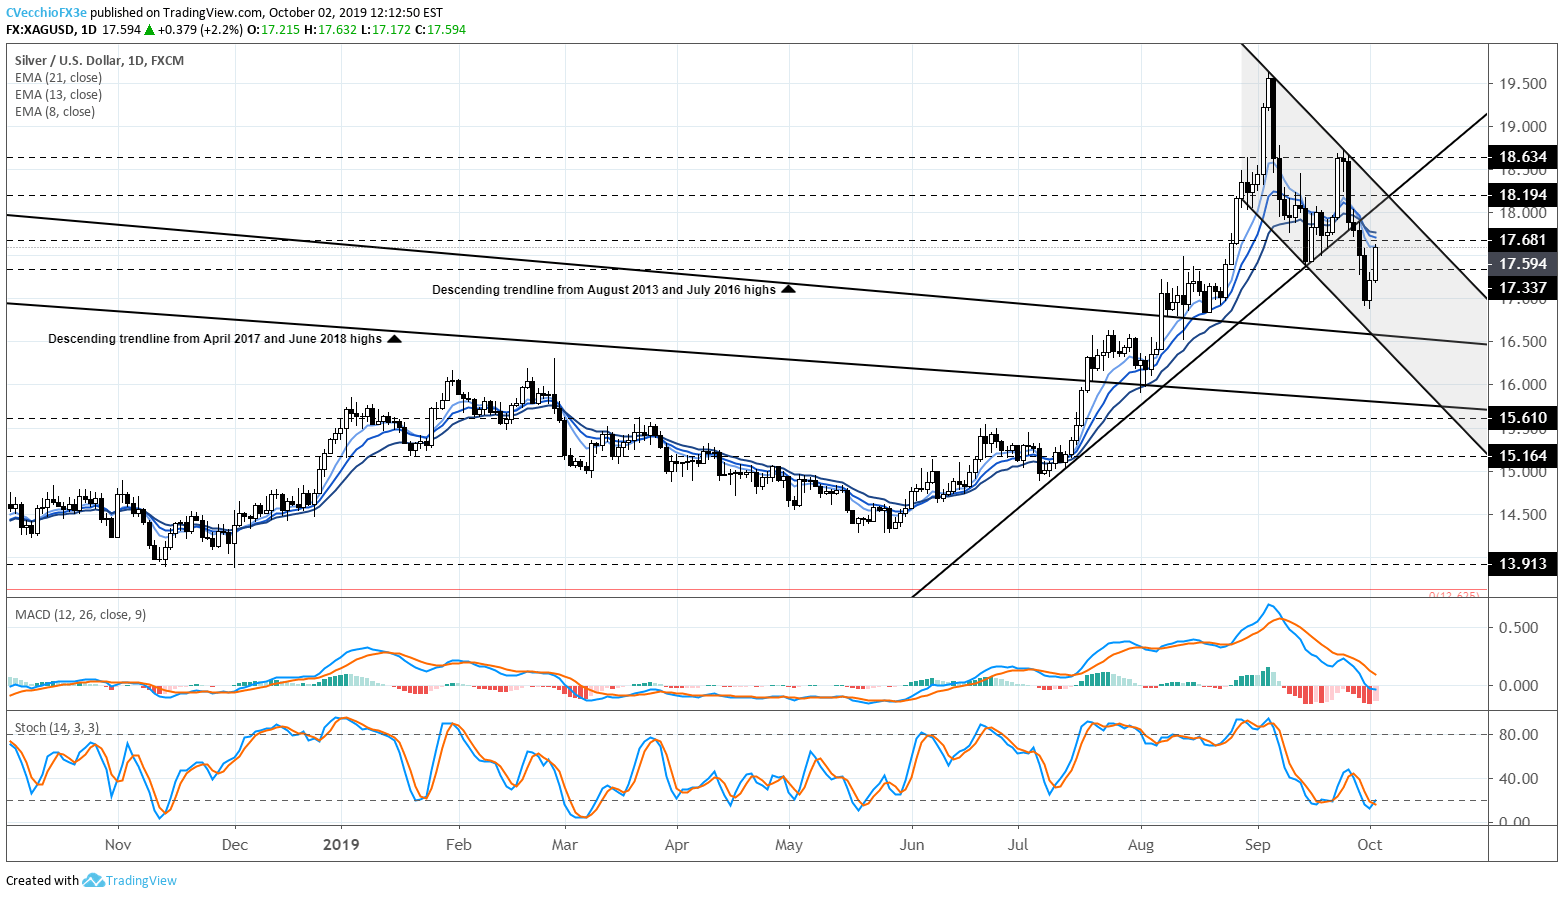
Like gold prices, silver prices may not be topping out but rather trading in the confines of a bull flag – a continuation pattern that calls for a resumption of the broader uptrend. The scope of the silver price bull flag is more acute, given the sharp decline from the swing highs in early- and late-September. Nevertheless, despite breaking the uptrend that defined priced action since July, there still remains potential for a turn higher.
For now, silver prices remain below the daily 8-, 13-, and 21-EMA envelope. Daily MACD continues to trend lower, on the verge of breaking into bearish territory. Slow Stochastics is attempting to climb out of oversold territory. If this is indeed a bull flag in silver prices, a return above 18.194 would be a confirmation signal that more gains are ahead. Until then, caution is warranted.
IG Client Sentiment Index: Spot Silver Price Forecast (OCTOBER 2, 2019) (Chart 5)
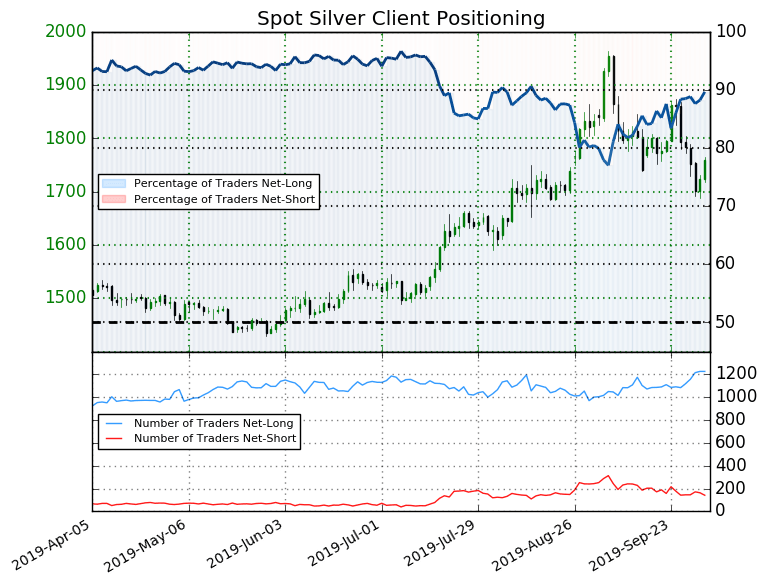
Spot silver: Retail trader data shows 89.7% of traders are net-long with the ratio of traders long to short at 8.7 to 1. The number of traders net-long is 3.4% lower than yesterday and 9.6% higher from last week, while the number of traders net-short is 18.5% lower than yesterday and 28.1% lower from last week.
We typically take a contrarian view to crowd sentiment, and the fact traders are net-long suggests spot silver prices may continue to fall. Traders are further net-long than yesterday and last week, and the combination of current sentiment and recent changes gives us a mixedspot silver-bearish trading bias.
FX TRADING RESOURCES
Whether you are a new or experienced trader, DailyFX has multiple resources available to help you: an indicator for monitoring trader sentiment; quarterly trading forecasts; analytical and educational webinars held daily; trading guides to help you improve trading performance, and even one for those who are new to FX trading.
--- Written by Christopher Vecchio, CFA, Senior Currency Strategist
To contact Christopher Vecchio, e-mail at cvecchio@dailyfx.com
Follow him on Twitter at @CVecchioFX
View our long-term forecasts with the DailyFX Trading Guides


