


Gold Price & Silver Technical Outlook:
- Gold has 2011/12 levels keeping price suppressed
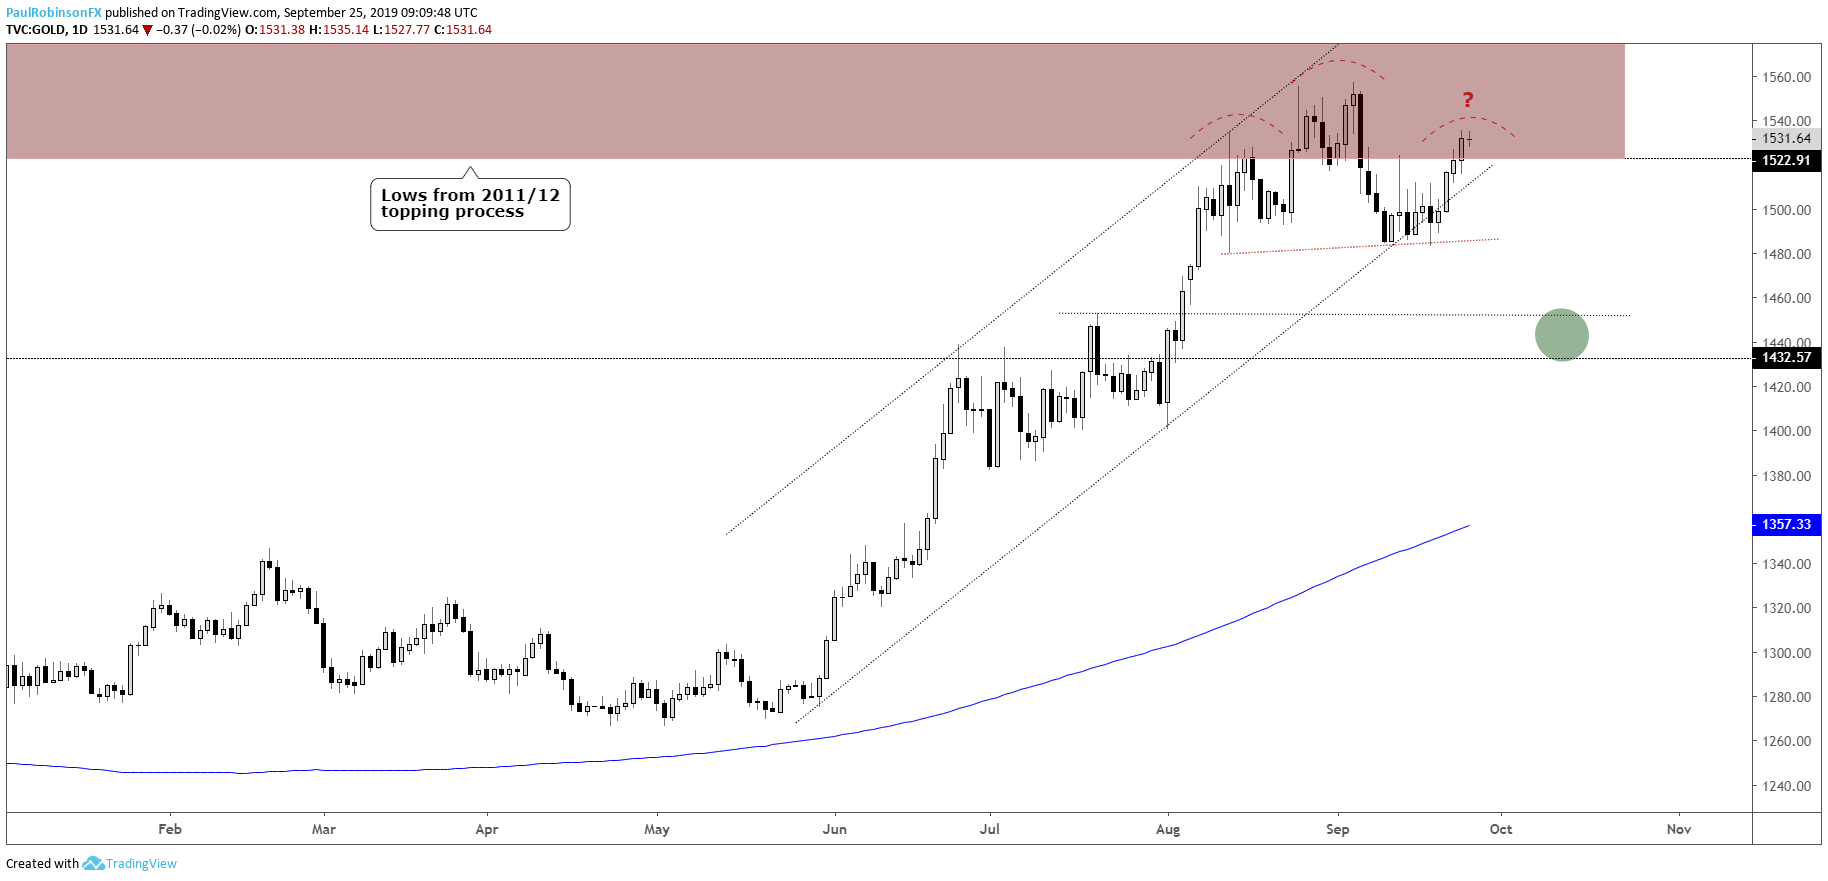
- H&S pattern still on the board but losing its shape
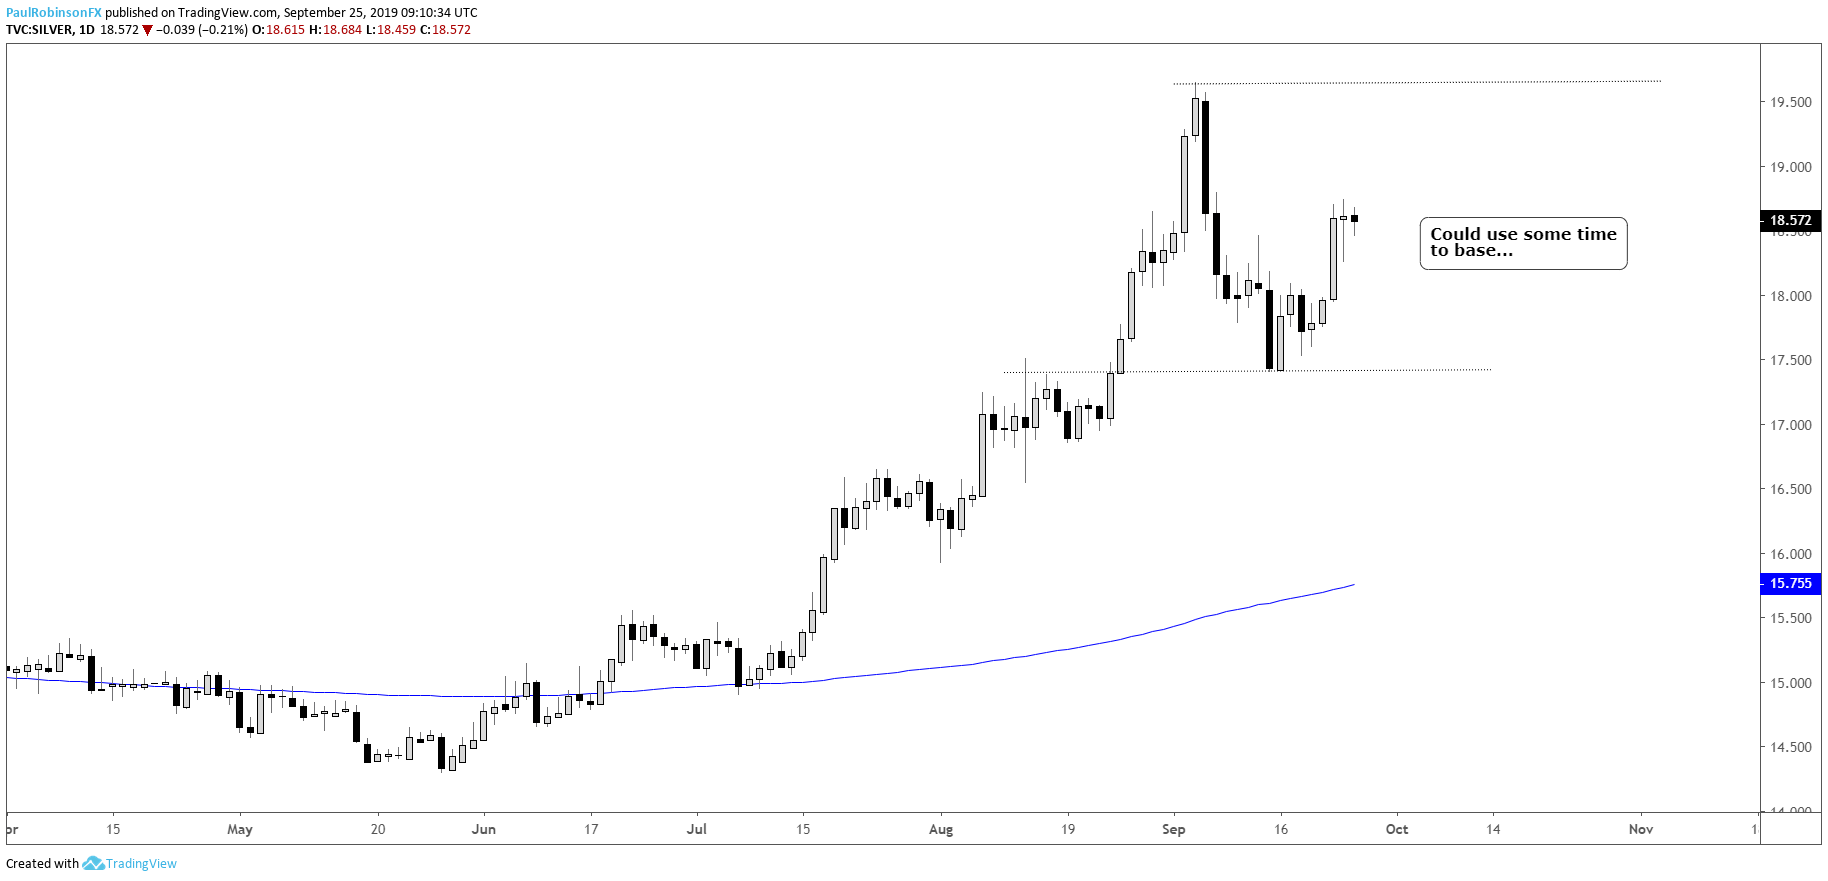
- Silver could use more time to digest summer rally
For an intermediate-term fundamental and technical viewpoint, see the Gold Forecast.
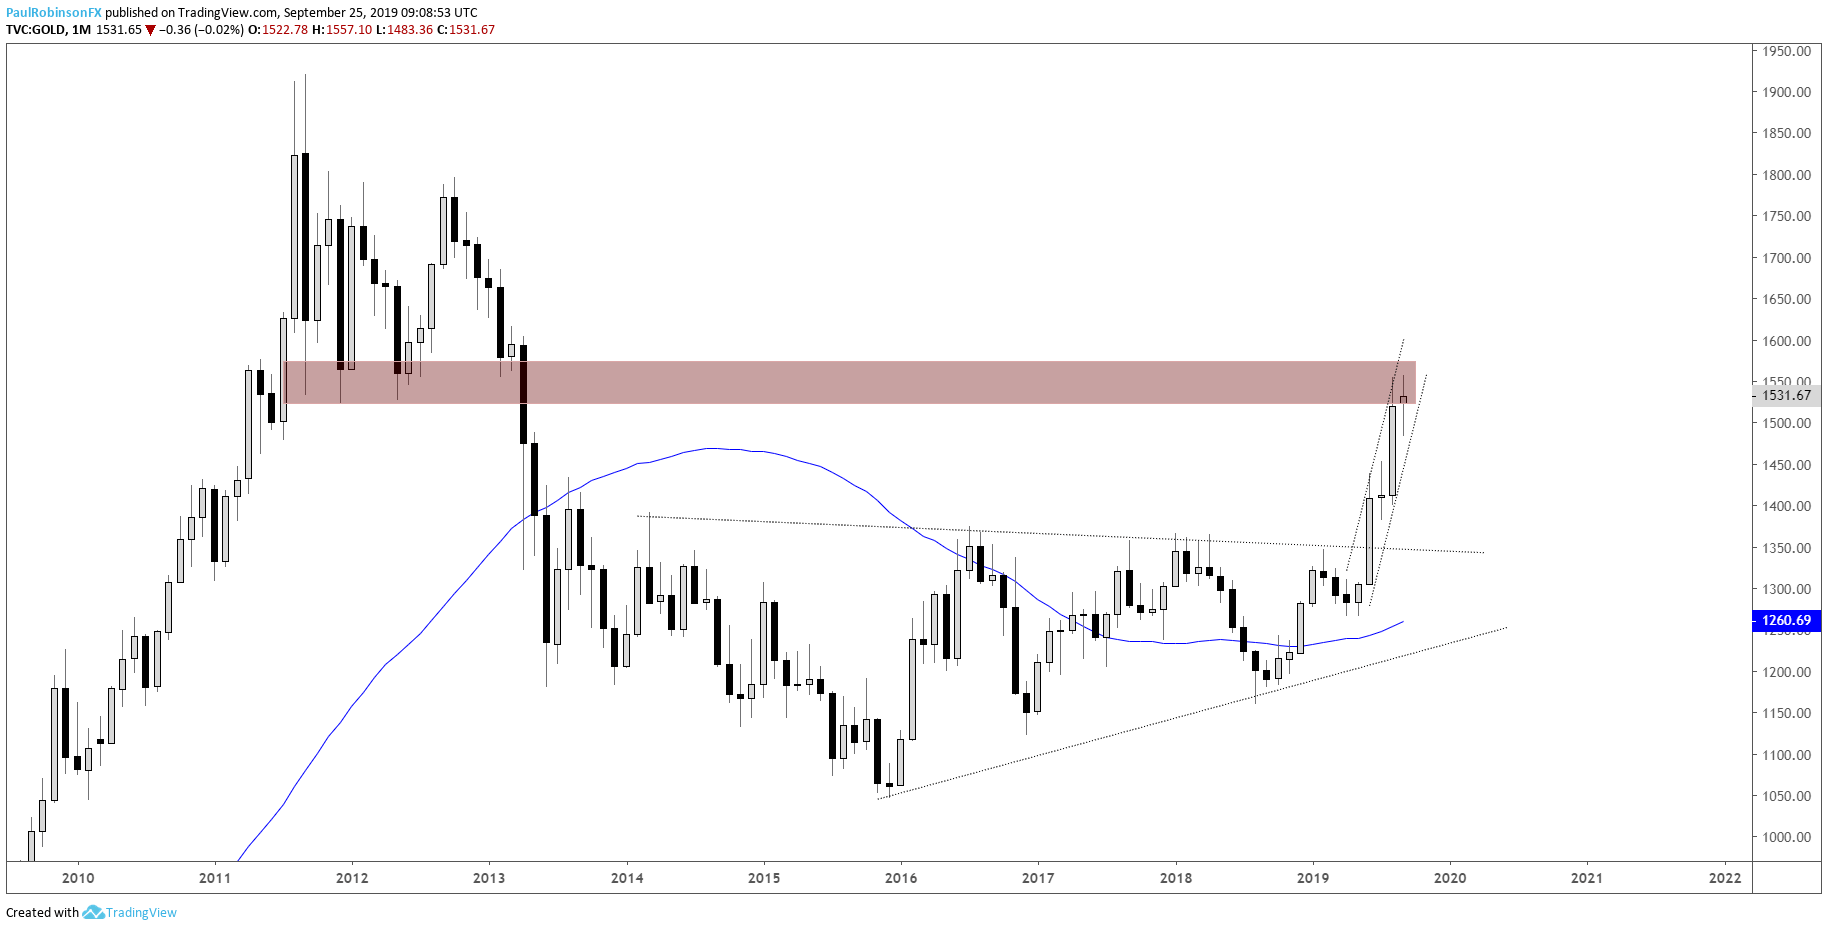
Gold has 2011/12 levels keeping price suppressed
Gold remains stuck under major long-term resistance with its makings from the 2011/12 topping process. So far it has held up a little better than anticipated as the head-and-shoulders (H&S) topping pattern has yet to trigger. If price don’t turn down soon the pattern will dissolve.
It’s a tough technical landscape to navigate. Buying into the thicket of resistance from 1522 up to 1575 puts fresh longs at immediate risk of reversing. Shorting hasn’t been fruitful since the decline off what could be the head of the H&S pattern.
A decline from here and break of 1484 is needed to get gold rolling downhill towards a larger retracement of the move over the past year. A breakout above 1575 is needed to get gold into the clear towards the highs from 2011/12 in the 1700/900-vicinity.
For now, sitting tight, but it seems still at best all gold can do from a bullish perspective is continue to build a base under resistance that gives it the platform from which it can rally to new heights. Should the H&S trigger than will allow for a stronger short bias towards the 1450/30-area.
Check out the IG Client Sentiment page to see how changes in trader positioning can help signal the next price move in gold and other major markets and currencies.
Gold Price Monthly Chart (2011/12 levels)
Gold Price Charts by Tradingview
Gold Price Daily Chart (H&S still possible)
Silver could use more time to digest summer rally
Silver has come out of its recent low with some decent strength and appears to ‘want’ to test the highs of the month, but it could use some more horizontal work before trying to run higher. Ideally, gold rolls over a bit and silver continues to maintain the monthly low at 17.41, exhibiting some relative strength in the process. This could set up traders for a good base to operate with.
Silver Daily Chart (could use some basing action)
Resources for Forex & CFD Traders
Whether you are a new or experienced trader, we have several resources available to help you; indicator for tracking trader sentiment, quarterly trading forecasts, analytical and educational webinars held daily, trading guides to help you improve trading performance, and one specifically for those who are new to forex.
---Written by Paul Robinson, Market Analyst
You can follow Paul on Twitter at @PaulRobinsonFX


