


Silver Price Talking Points:
- With the US-China trade war back in détente, US Treasury yields have jumped sharply, reducing the safe haven appeal of precious metals. US Treasury yields have increased by their fastest rate since January 2019.
- If a short-term pullback takes shape, traders may want to consider the opportunity to engage the longer-term bullish bottoming effort in silver prices.
- Recent changes in sentiment gives us a stronger spot silver-bearish contrarian trading bias in the short-term.
Looking for longer-term forecasts on Gold and Silver prices? Check out the DailyFX Trading Guides.
Has the wall of worry collapsed? The US-China trade war is back in a state of détente; a no-deal, hard Brexit won’t transpire on October 31; and odds of a recession hitting the United States are in flux as global growth concerns retreat. The acute reaction in global financial markets, producing higher sovereign bond yields and surging equity markets, is a sign that investors feel the worst may be in the past.
In other words, as Emmet Brickwoski would say, “Everything is awesome!” And while “everything is awesome” for most asset classes today, there is a noticeable loser: precious metals.
US YIELDS ARE A KEY FACTOR
As the US-China trade war has shifted from attrition to détente, investors feel that the threat of a sharp slowdown to the global economy has receded. Rising oil prices underscore the bump in growth expectations. But the most important aspect of the move in markets this week is what’s going on with bonds. The sharpest rise in short- (1m to 2y) and medium-term (3y to 7y) US Treasury yields since January 2019 is giving traders a good reason to reconsider their holdings of precious metals.
WHY DO ‘REAL YIELDS’ MATTER TO SILVER PRICES?
The jump in US Treasury yields around the latest US-China trade war news undermines one of precious metals’ most important motivating factors: falling real yields.
Real yields are inflation-adjusted yields: in this case, the US Treasury 10-year yield minus the headline inflation rate. Why does this matter? Investing is all about asset allocation and risk-adjusted returns. On the asset allocation side, it’s about achieving required returns given the investor’s wants and needs.
If inflation expectations are rapidly increasing, you would expect to see fixed income underperform: the returns are fixed, after all. Why would you want to have a fixed return when prices are increasing? On a real basis, your returns would be lower than otherwise intended.
Falling US real yields means that the spread between Treasury yields and inflation rates are decreasing. If precious metals yield nothing (no dividends, coupons, or cash flows), they would best suited to rally when US real yields fell. On the flipside, environments defined by rising US real yields – which we’re seeing unfold today – would serve to hurt precious metals like gold and silver.
Silver Prices Dragged Lower by Plunge in Silver Volatility
While other asset classes don’t like increased volatility (signaling greater uncertainty around cash flows, dividends, coupon payments, etc.), precious metals tend to benefit from periods of higher volatility as uncertainty increases gold’s and silver’s safe haven appeal.
VXSLV (SILVER VOLATILITY) TECHNICAL ANALYSIS: DAILY PRICE CHART (APRIL 2016 TO SEPTEMBER 2019) (CHART 1)
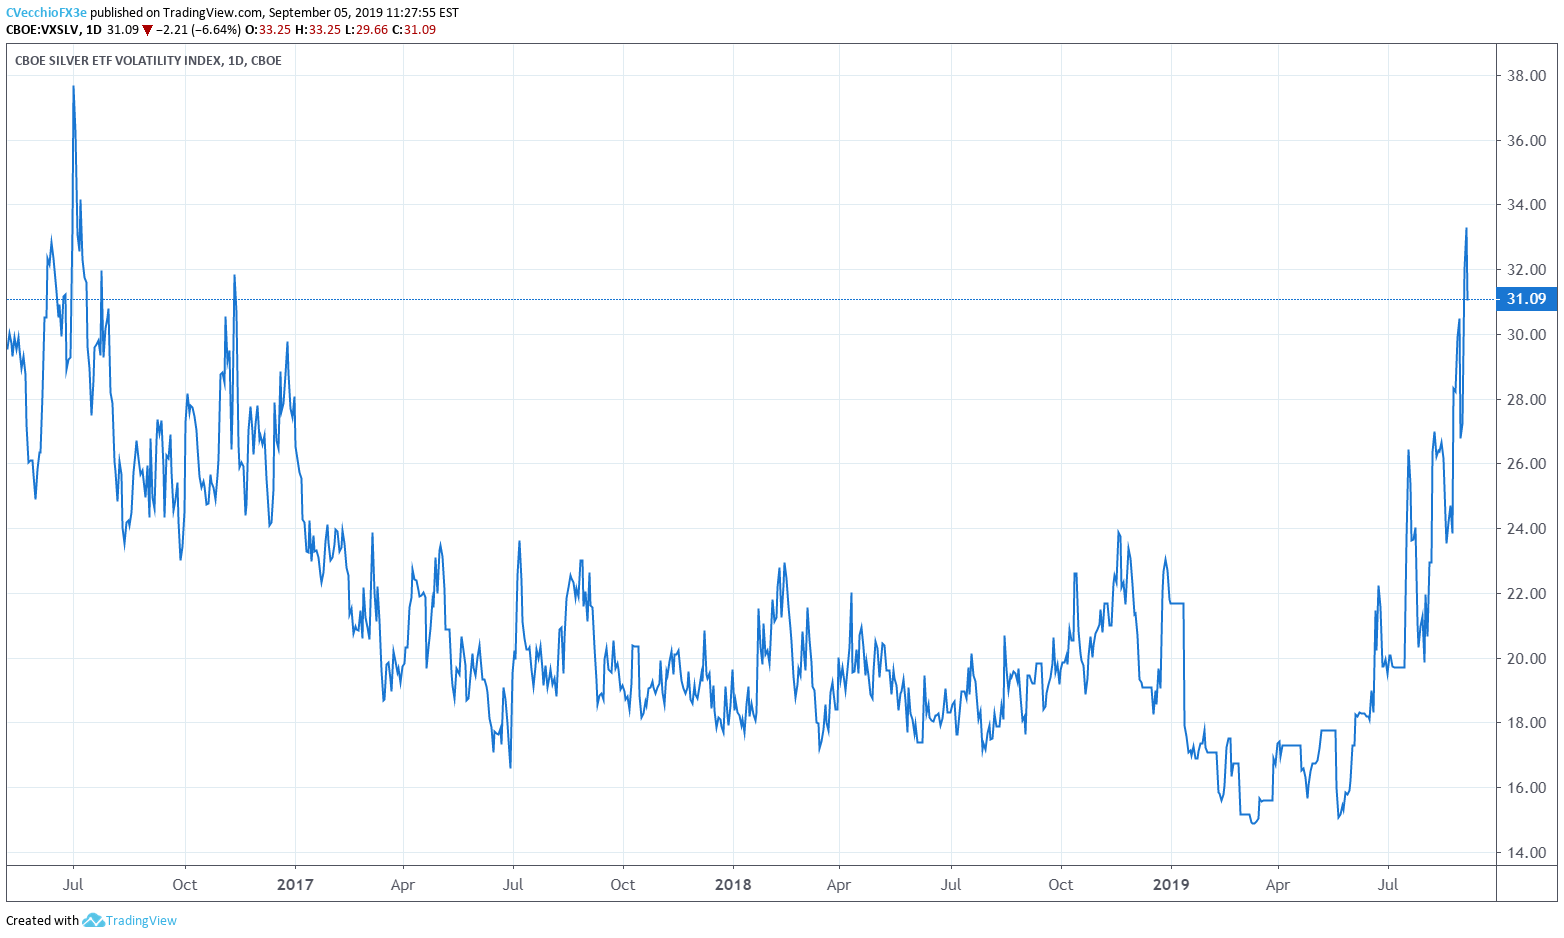
Silver volatility (as measured by the Cboe’s gold volatility ETF, VXSLV, which tracks the 1-month implied volatility of gold as derived from the SLV option chain) is running higher around the latest US-China trade war developments. VXSLV is currently trading at 31.09, down from 34.56 earlier this week, its highest level since January 3, 2017. To this end, if VXSLV pulls back further, it is likely that silver prices soon follow: the 5-day correlation between VXSLV and silver prices is 0.97 and the 20-day correlation is 0.88.
SILVER PRICE TECHNICAL ANALYSIS: WEEKLY CHART (AUGUST 2013 TO SEPTEMBER 2019) (CHART 2)
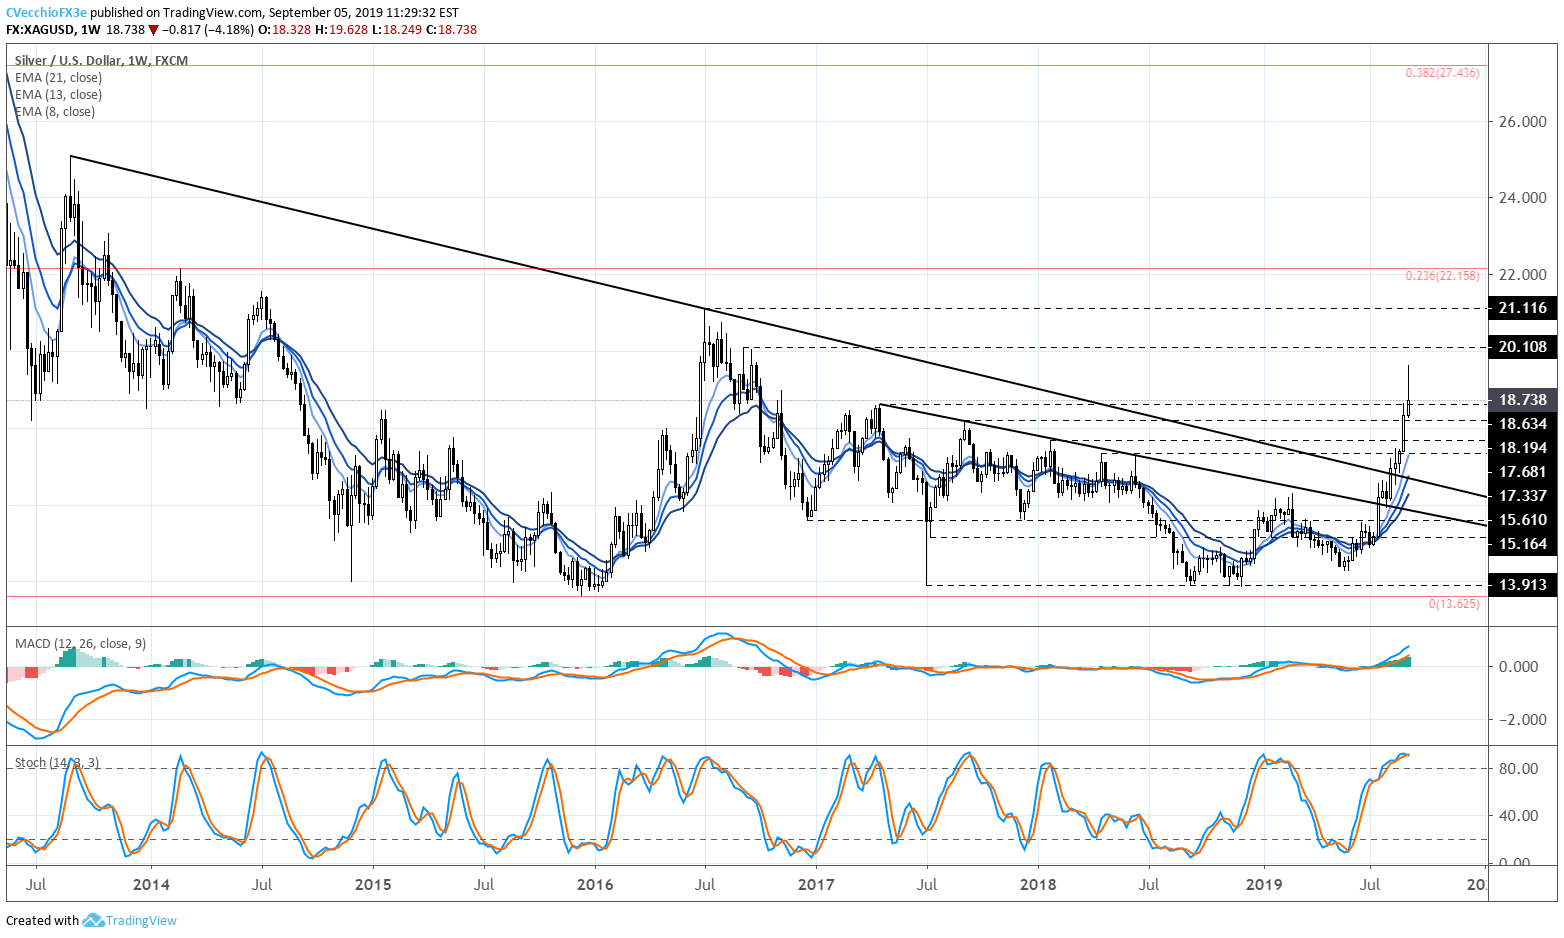
The move by silver prices above the April and September 2017 and the June 2018 swing highs, as well as the 2013 and 2016 swing highs, has been maintained in recent days. Having cleared out the 2018 and 2017 highs, there is more evidence to support the idea that a major long-term bottoming effort in silver prices is taking place. Traders should be cautioned that the weekly shooting star/inverse hammer warns of potential for a bearish reversal in the near-term.
SILVER PRICE TECHNICAL ANALYSIS: DAILY CHART (DECEMBER 2017 TO SEPTEMBER 2019) (CHART 3)
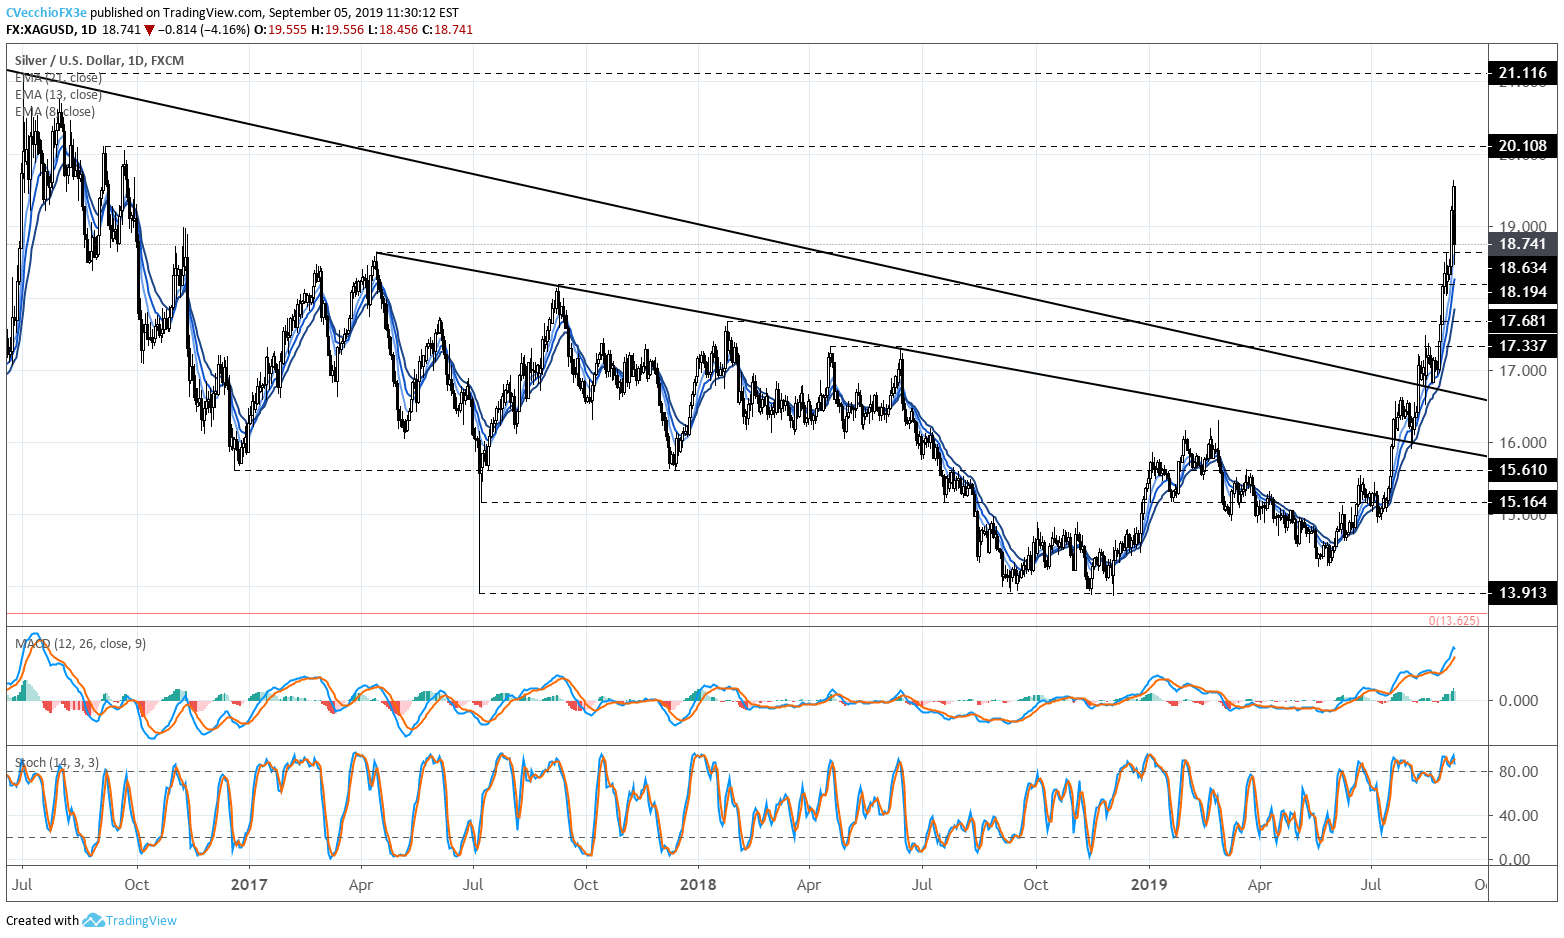
In our most recent silver price technical forecast update, it was noted that “. A break above near-term doji resistance at 17.489 would signal a bullish continuation effort for silver prices. The measured move now calls for silver prices to trade into 18.468.” Having achieved this breakout target, silver prices may be due for a period of profit taking – traders digesting the recent move, if you will.
SILVER PRICE TECHNICAL ANALYSIS: DAILY CHART (SEPTEMBER 2018 TO SEPTEMBER 2019) (CHART4)

The bearish outside engulfing bar on the daily chart further reinforces the idea of a potential for a short-term pullback. With silver prices above their daily 8-, 13-, and 21-EMA, it’s too soon to call ‘the top.’ Both daily MACD and Slow Stochastics remain in bullish territory; the latter remains overbought. Silver prices have not closed below the daily 8-EMA since August 23 or the daily 21-EMA since July 11.
IG Client Sentiment Index: Spot Silver Price Forecast (SEPTEMBER5, 2019) (Chart 5)
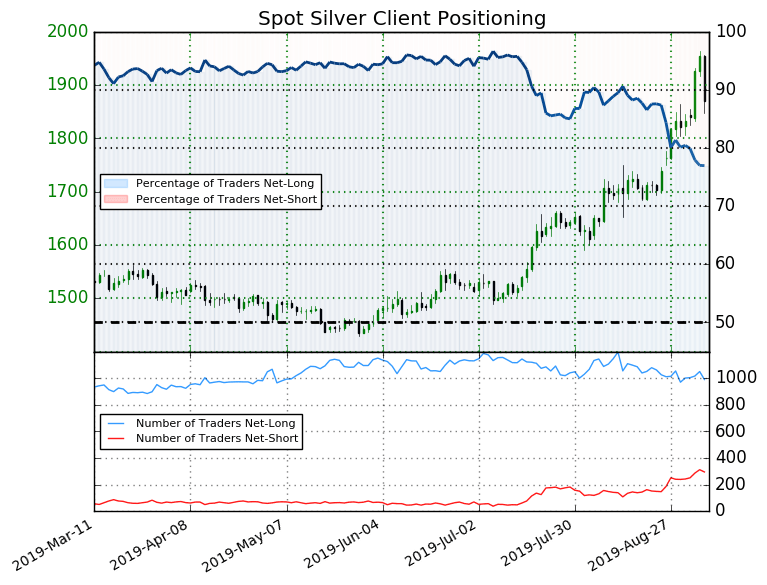
Spot silver: Retail trader data shows 77.0% of traders are net-long with the ratio of traders long to short at 3.34 to 1. The number of traders net-long is 3.5% lower than yesterday and 5.0% lower from last week, while the number of traders net-short is 12.2% lower than yesterday and 13.0% higher from last week.
We typically take a contrarian view to crowd sentiment, and the fact traders are net-long suggests spot silver prices may continue to fall. Traders are further net-long than yesterday and last week, and the combination of current sentiment and recent changes gives us a stronger spot silver-bearish contrarian trading bias.
FX TRADING RESOURCES
Whether you are a new or experienced trader, DailyFX has multiple resources available to help you: an indicator for monitoring trader sentiment; quarterly trading forecasts; analytical and educational webinars held daily; trading guides to help you improve trading performance, and even one for those who are new to FX trading.
--- Written by Christopher Vecchio, CFA, Senior Currency Strategist
To contact Christopher Vecchio, e-mail at cvecchio@dailyfx.com
Follow him on Twitter at @CVecchioFX
View our long-term forecasts with the DailyFX Trading Guides


