


Gold/Silver Technical Highlights:
- Reversal on Thursday has gold price pointed higher
- Silver holding big zone of support, H&S pattern still on the table
See what fundamental drivers and technical signposts our team of analysts are watching in the DailyFX Q2 Gold Forecast.
Reversal on Thursday has gold price pointed higher
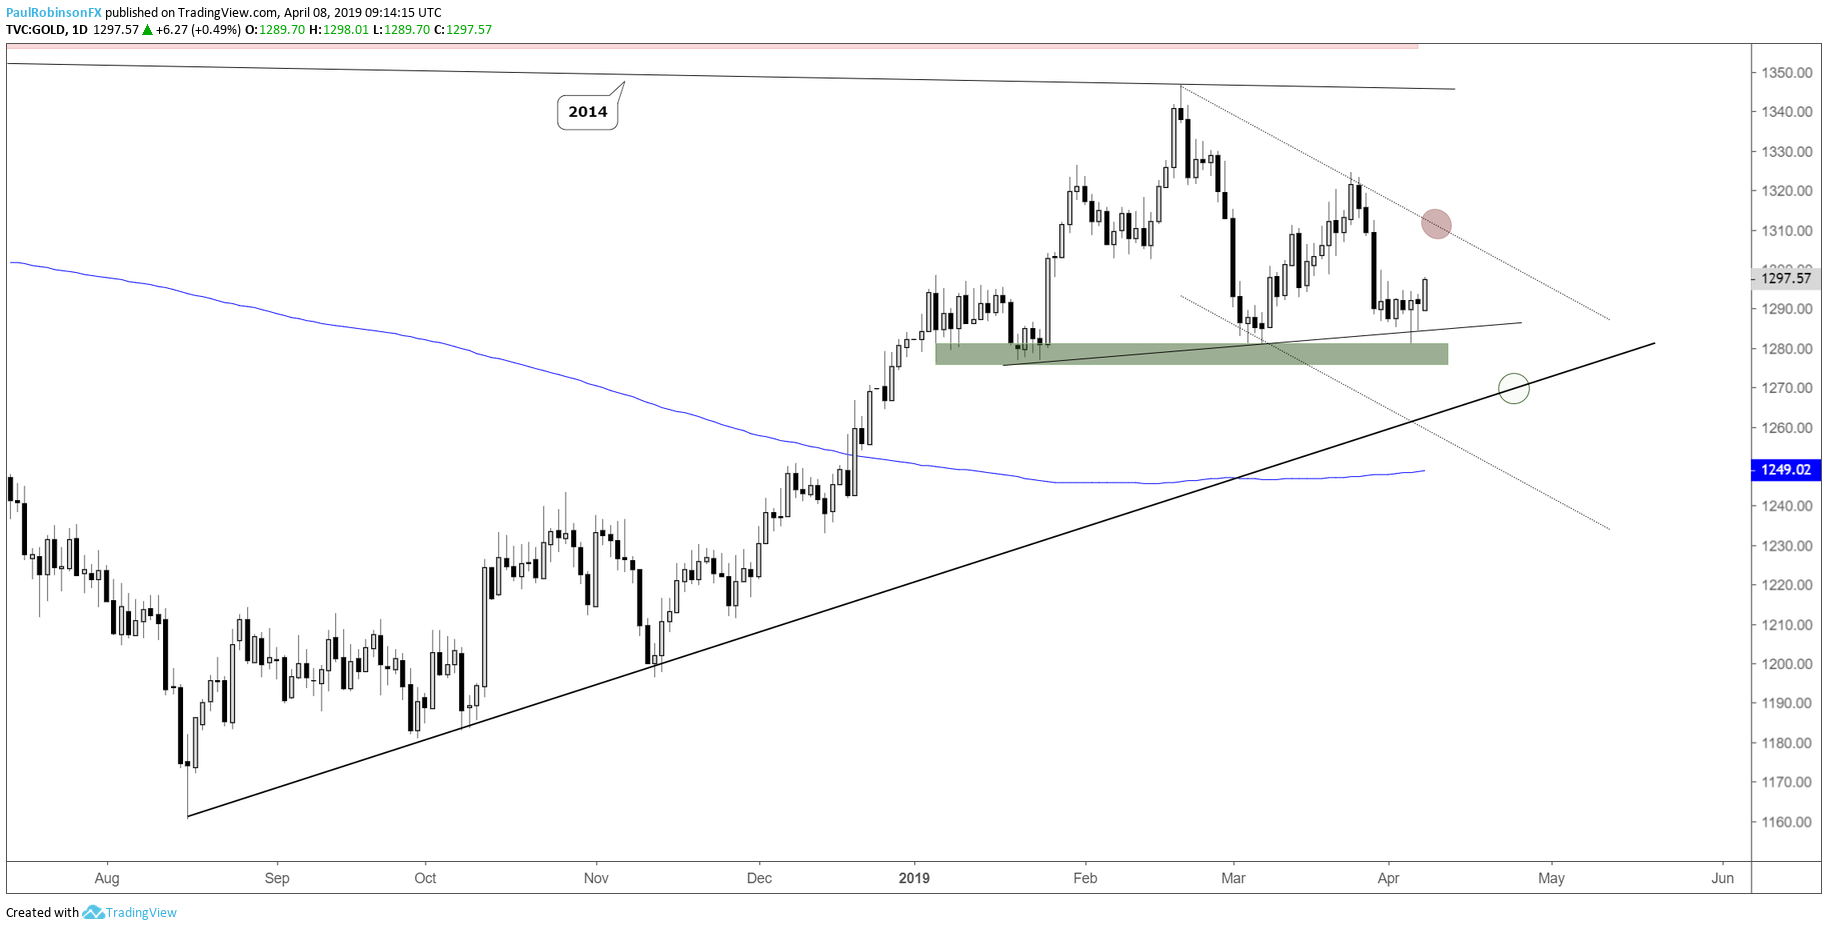
On Thursday, gold reversed higher from last month’s low and following a failed attempt to break the trend-line running over from January. So far, this has led to modest short-term strength and could lead to a bit more in the days ahead.
Looking higher, the first line of resistance doesn’t clock in until the t-line off the Feb high that runs down over last month’s high. Depending on the timing of a run-in with the downward sloping line of resistance, gold may trade up another $10-15 before struggling again.
Should the bounce fizzle before the, the threshold to watch on the downside is 1281, the low from Thursday and March. A break through there is seen as likely to lead to the trend-line off the August low or worse.
Check out the IG Client Sentiment page to see how changes in trader positioning can help signal the next price move in gold and other major markets and currencies.
Gold Daily Chart (Reversal may bring t-line into play)
Silver holding big zone of support, H&S pattern still on the table
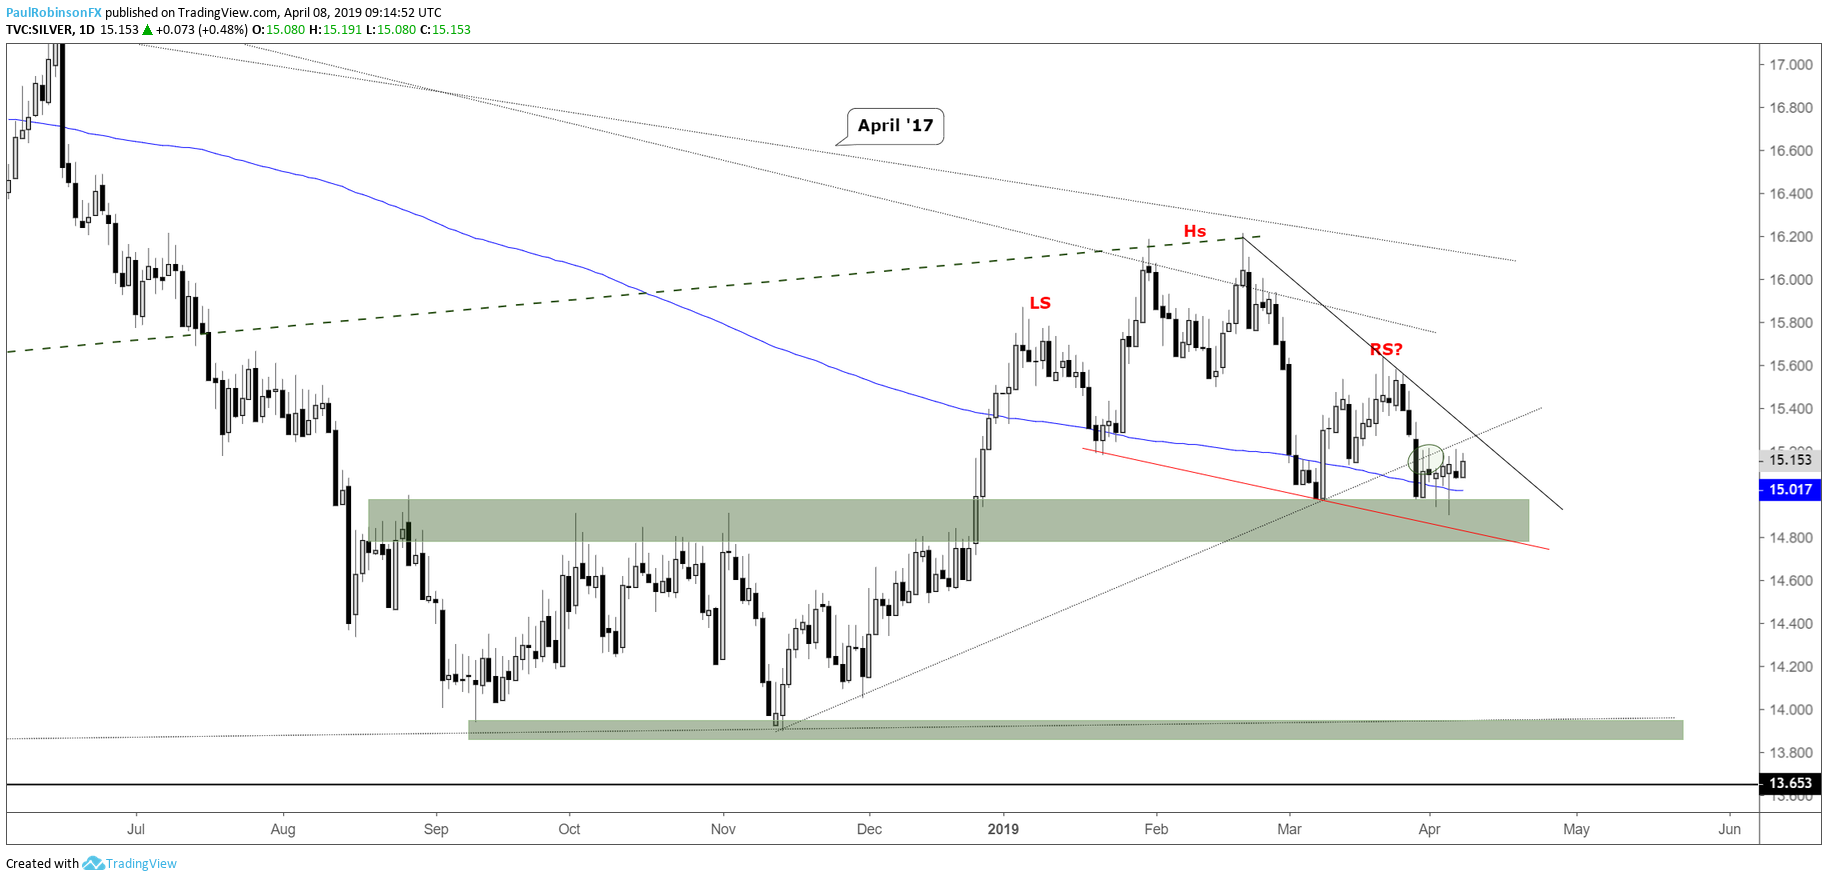
Silver is holding into several angles of support: March low, the 200-day MA, and the top of a range from last year. Just a hair below Thursday’s reversal lies the neckline of the head-and-shoulders pattern dating back to January.
Indeed, a big area from around 15 down to 14.70-ish, which if broken would validate the H&S top. But until we see a confirmed break support is to be respected. There is trend-line resistance just ahead from the February high and underside of the line from November.
The alternative scenario to the H&S formation is for the price sequence to further along and develop a mature descending wedge. This pattern would consist of the neckline and the trend-line from the February high. A break of the top-side trend-line may set in motion a squeeze. Right now, it is viewed as the lower probability scenario, but one worth taking into consideration as support continues to hold.
Silver Daily Chart (big support holding so far)
Resources for Forex & CFD Traders
Whether you are a new or experienced trader, we have several resources available to help you; indicator for tracking trader sentiment, quarterly trading forecasts, analytical and educational webinars held daily, trading guides to help you improve trading performance, and one specifically for those who are new to forex.
---Written by Paul Robinson, Market Analyst
You can follow Paul on Twitter at @PaulRobinsonFX


