


Gold/Silver Technical Highlights:
- Gold makes new leg higher, has 1350/60-area in focus
- Silver weaker, trading back at long-term trend-lines
See what drivers DailyFX analysts expect to move Gold in the coming weeks in the Q1 Gold Forecast.
Gold makes new leg higher, has 1350/60-area in focus
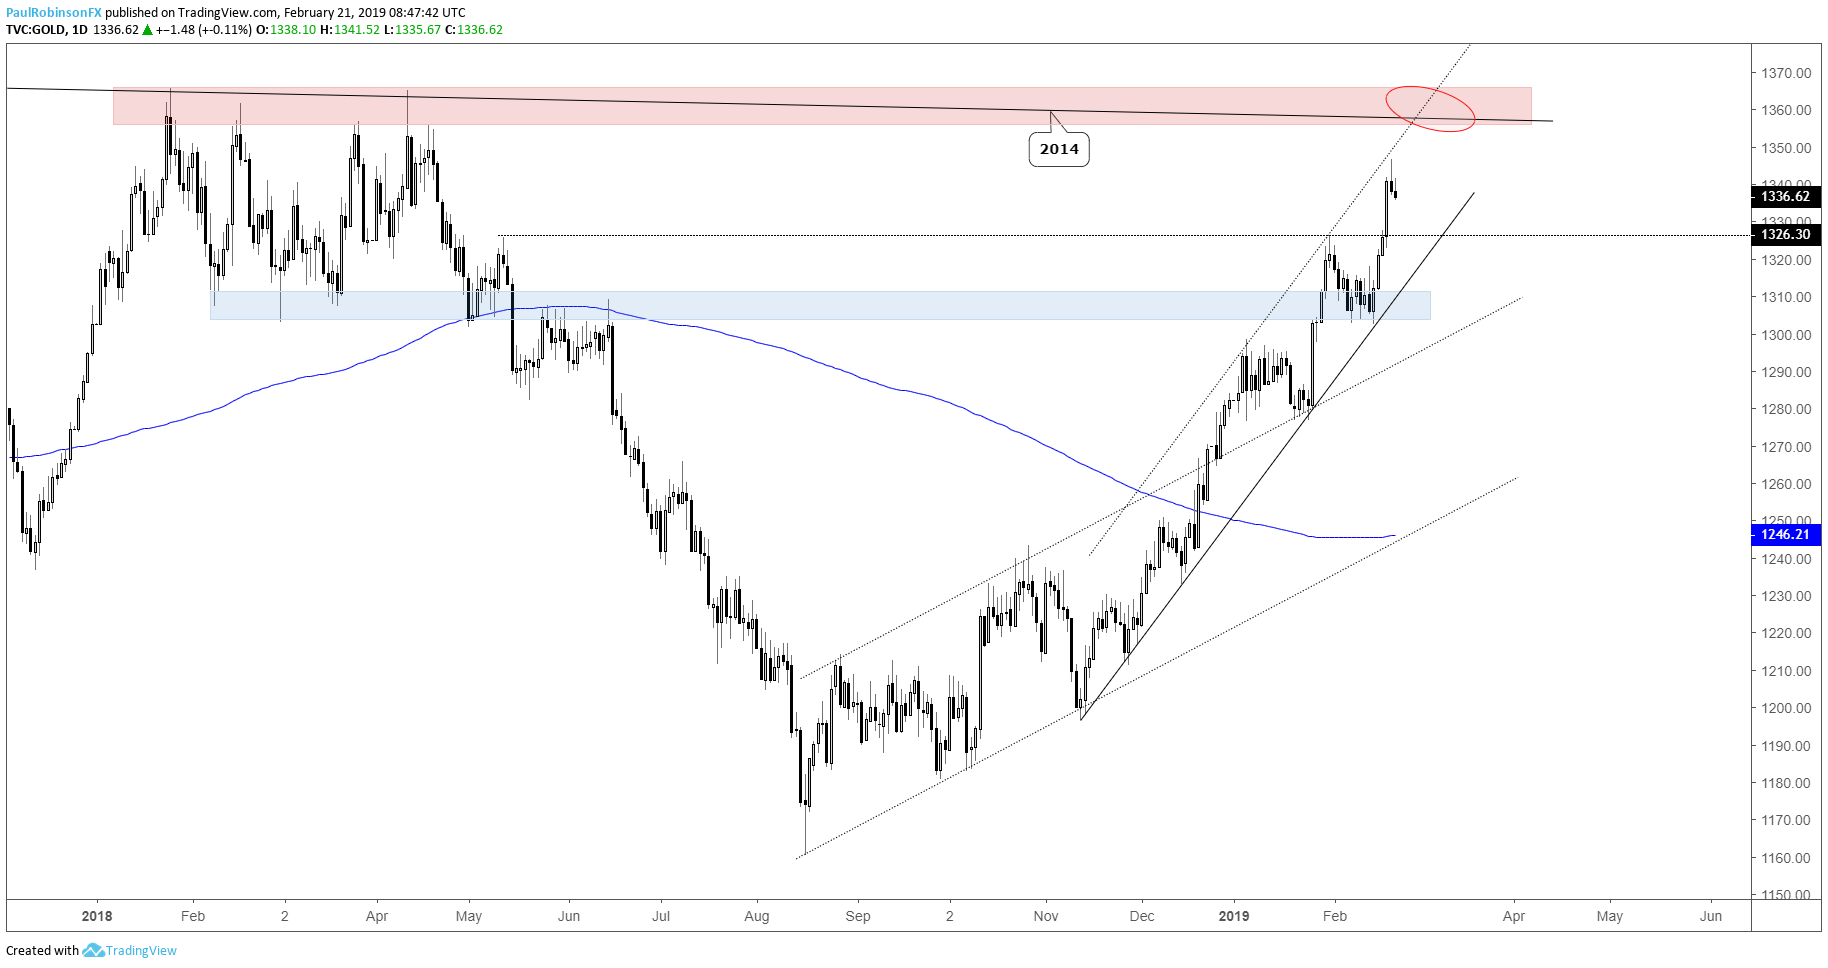
Last week, when I last looked at gold it was probing support by way of a zone extending back to last year and the trend-line off the November low. The surge from support posted not only a higher-high in the rally sequence dating back to August, but now has significant long-term resistance in focus.
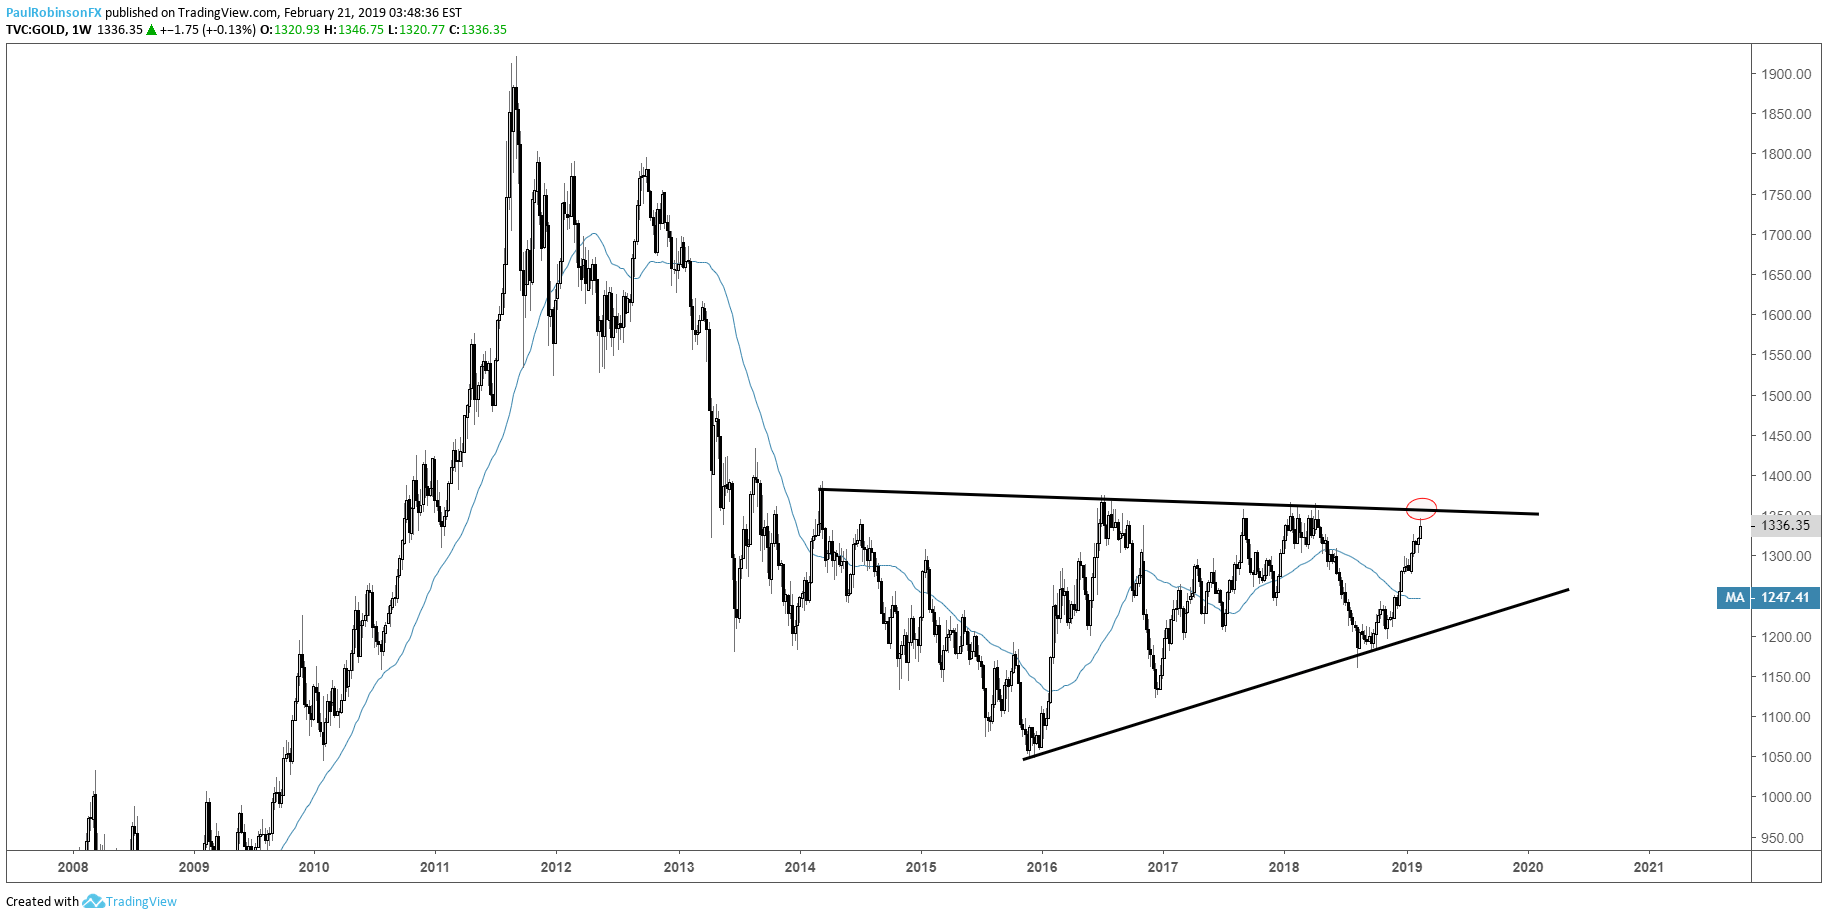
For the past few years gold has been undergoing a significant period of consolidation and with it a triangle has been maturing. The top-side trend-line extends over all the way from 2014, crossing several peaks grouped together during the first part of 2018 in the vicinity of 1350/66.
The combo of trend-line and price resistance (as a result of the t-line) makes the upcoming spot a very important one both short and long-term. The thinking on this end is that at the very least we will see a pullback develop from major resistance even if gold is to trade on through and spark a major breakout above 1375.
Gold has a little room to go before it thoroughly tests resistance, however; risk/reward for longs has become quite unfavorable while the short-side is becoming increasingly appealing with a major backstop to use for assessing risk.
Check out the IG Client Sentiment page to see how changes in trader positioning can help signal the next price move in gold and other major markets.
Gold Daily Chart (big resistance ahead)
Gold Weekly Chart (Big wedge forming)
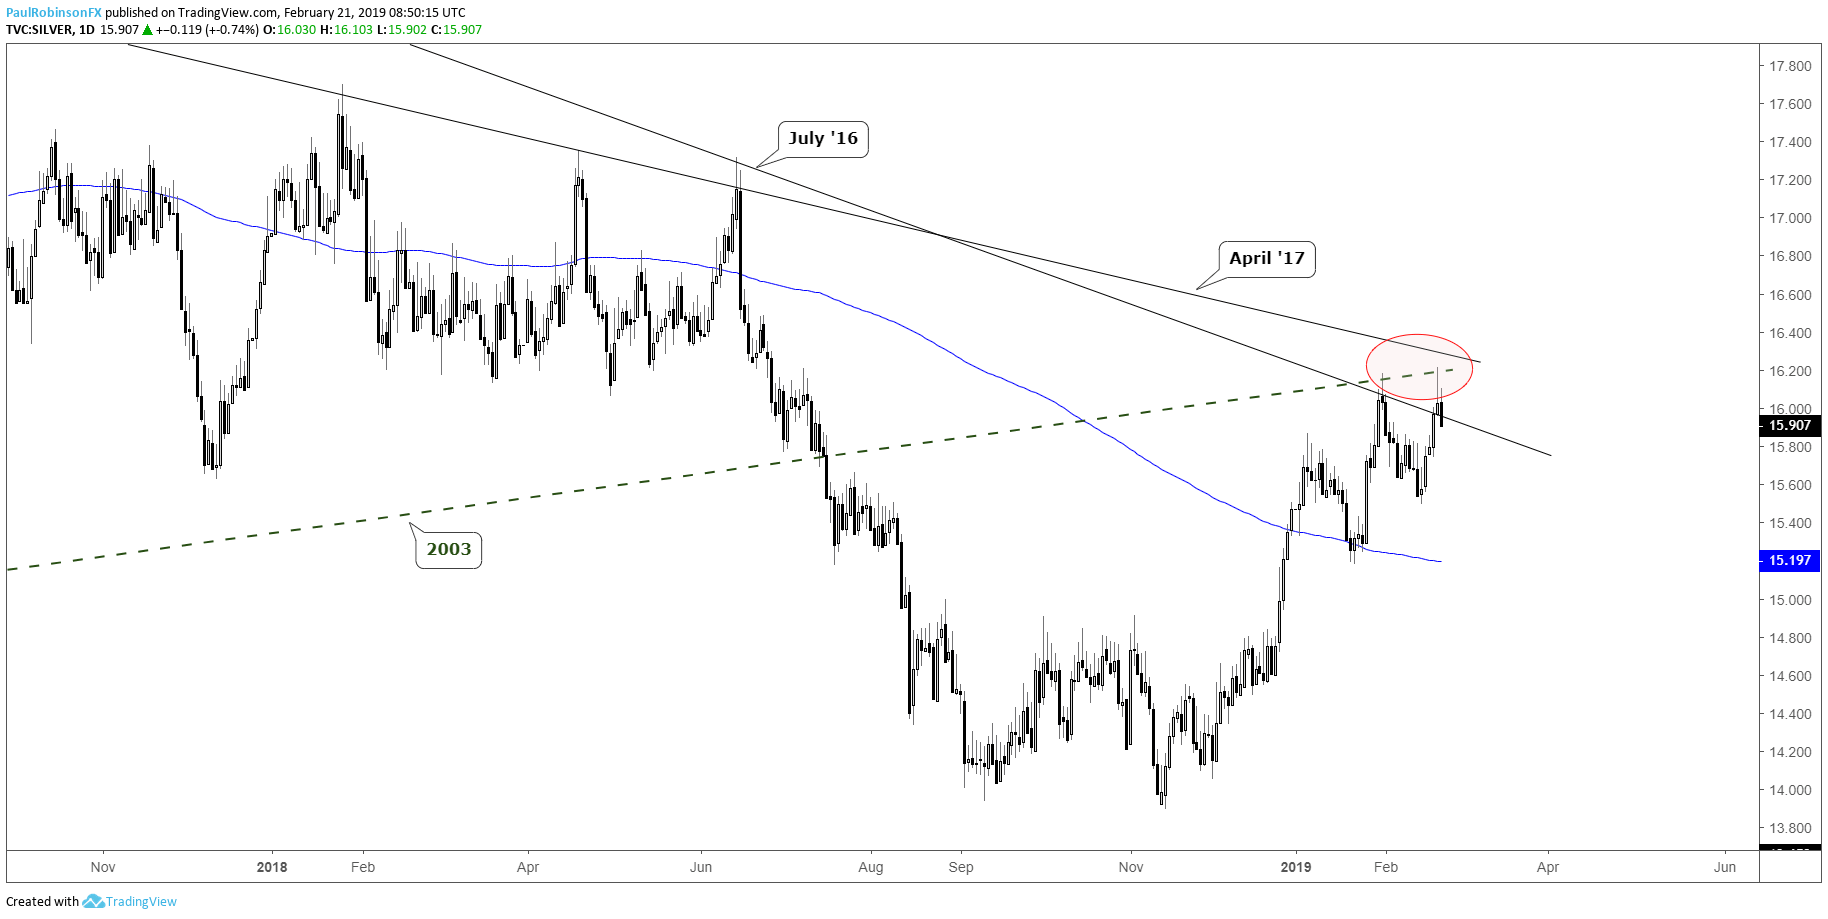
Silver weaker, trading back at long-term trend-lines
The story for silver remains the same – weaker than gold. As noted last week, with silver also trading around major long-term trend-lines it is viewed as the least favorable as a long between the two major precious metals. The July 2016 trend-line, underside of the 2003 trend-line, along with another from April 2017 make the current area a tough one for silver.
Yesterday, a rejection took place on an attempt to trade above the Jan 31 high and through resistance. Depending on how gold handles upcoming resistance (assuming it gets there), silver may see itself back off quite hard if the sector weakens.
Silver Daily Chart (several lines of resistance)
Resources for Forex & CFD Traders
Whether you are a new or experienced trader, we have several resources available to help you; indicator for tracking trader sentiment, quarterly trading forecasts, analytical and educational webinars held daily, trading guides to help you improve trading performance, and one specifically for those who are new to forex.
---Written by Paul Robinson, Market Analyst
You can follow Paul on Twitter at @PaulRobinsonFX


