


Gold/Silver Technical Highlights:
- April trend-line keeping gold contained
- Broader bear-flag development could be in store
- Silver remains the laggard, kept down by t-line too
See where DailyFX analysts see Gold heading into year-end and the expected drivers in the Q4 Gold Trading Forecast.
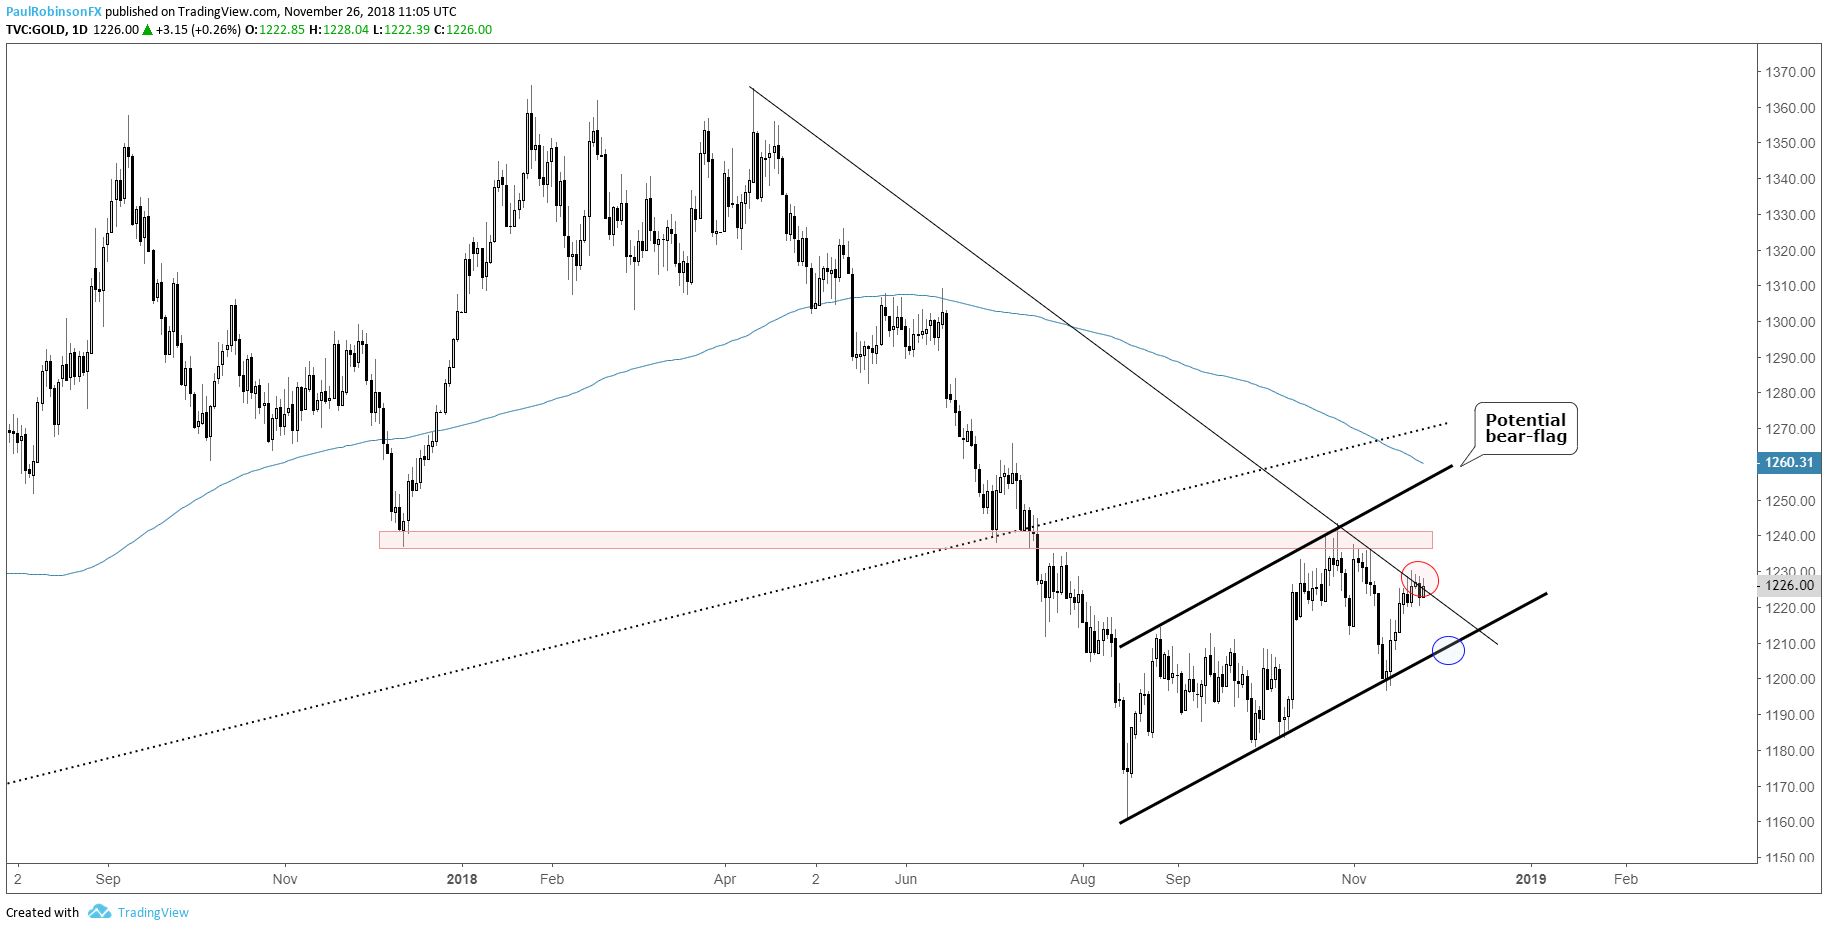
Gold battling April trend-line
Gold has been churning the past few days at trend-line resistance running down from the peak in April. A break on through will help bolster the case for longs, but only modestly so as resistance from around 1235 up to 1243 will yet need to be overcome if gold is to trade further into open space.
While a break higher could provide some short-term breathing room, more broadly speaking a bear-flag could be under development since the low in August. A break higher and further filling out of the pattern would mean it could be some time before an eventual bearish trigger, but a scenario worth thinking about on a move to the upper parallel from this summer towards the 200-day.
A move lower from the April t-line will have the August t-line quickly into view and will be important for gold to hold if it is to keep from potentially continuing another round of weakness as seen through much of the year. If the pace of trading continues as it has lately price may get bottled up between the two trend thresholds before resolving one way or another. Right now, risk/reward isn’t particularly appealing from either side of the tape.
Gold traders are collectively holding a large long position, check out IG Client Sentiment for details as to how this may be a headwind for the precious metal.
Gold Daily Chart (at April t-line)
Silver remains the laggard, kept down by t-line too
Silver’s price action is even less inspiring than gold’s, making it a tough market to get a hold on. It, like gold, has a trend-line running lower, starting back from the June peak. A hold below keeps the downside trend well intact, while a break higher will bring into play a multi-week set of peaks around ~14.80/91 formed heading into this month.
Silver Daily Chart (June t-line resistance)

To learn more about the relationship between gold and silver, check out this piece - 'Trading the Gold-Silver Ratio'.
Resources for Forex & CFD Traders
Whether you are a new or experienced trader, we have several resources available to help you; indicator for tracking trader sentiment, quarterly trading forecasts, analytical and educational webinars held daily, trading guides to help you improve trading performance, and one specifically for those who are new to forex.
---Written by Paul Robinson, Market Analyst
You can follow Paul on Twitter at @PaulRobinsonFX


