


Gold/Silver technical highlights:
- Gold, something has to give – LT trend-line or bottom of range
- Silver chart has a triangle inside broader congestion
- Silver may end up with more violent move, but gold preferred
Traders are long gold, check out the IG Client Sentiment page to see how this acts as a contrarian indicator.
Gold, something has to give – LT trend-line or bottom of range
Last week, when we were discussing precious metals, the questions we asked – when will trading gold and silver get better? It’s been a difficult market, but perhaps soon, at the least, we will get a little one-way follow-through.
Back in mid-May, when gold broke out of the brutal range dating back to January it looked as though we might see decent one-way trade, but there was still an obstacle sitting in shorts’ way – the December 2016 trend-line. That line held up then and again yesterday.
The bottom of the broken range has continued to keep a lid on the top-side. The containment, due to the rising nature of the trend-line, is growing smaller, and with a narrowing range between a pair of important technical thresholds we have pent up energy for a material price move.
In-line with the range-break from last month, a decline below the 2016 trend-line (and 1282) would be ideal given there isn’t anything significant by way of support for a good distance lower, not until the December swing-low and December 2015 trend-line, both situated relatively close to one another in the low-1240s, 1236 area.
Should gold recapture the range and close back inside the range (1307+), then top-side momentum could carry price higher. The caveat to this scenario is all that price congestion from January to May standing in the way. At any rate, we would run with a semi-bullish outlook.
Gold Daily Chart (Something has to give)

For the intermediate-term fundamental/technical outlook, check out the Gold Forecast
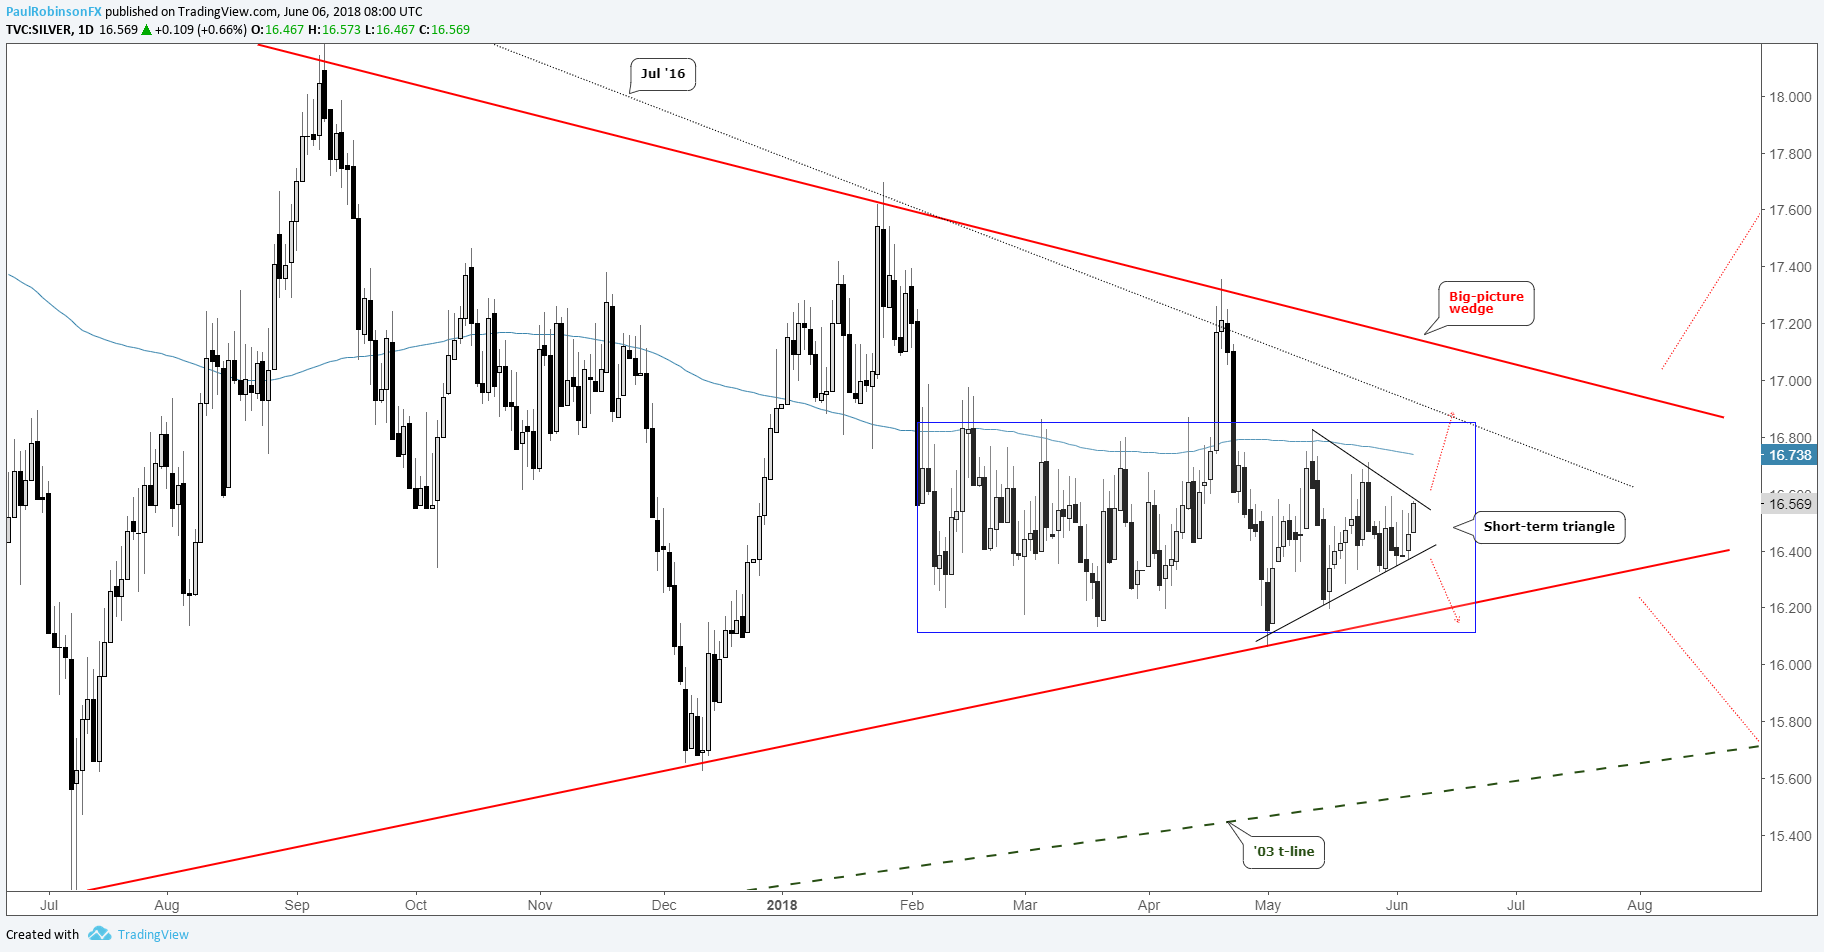
Silver chart has a triangle inside broader congestion
Silver has been coiling up as of late within a broader mess of choppy trading, and that broader mess of choppy trading is within the confines of a longer-term triangle. This is why when looking at the two major precious metals gold is the preferred market to trade.
But nevertheless, the month-long triangle nearing a breakout should give it a shove higher or lower. A top-side break will have the 16.80s quickly in focus, followed by 17. A down-side break will have the 16.20s quickly in focus.
Silver Daily Chart (Triangle on Verge of Breaking)
Resources for Forex & CFD Traders
Whether you are a new or experienced trader, we have several resources available to help you; indicator for tracking trader sentiment, quarterly trading forecasts, analytical and educational webinars held daily, trading guides to help you improve trading performance, and one specifically for those who are new to forex.
---Written by Paul Robinson, Market Analyst
You can follow Paul on Twitter at @PaulRobinsonFX


