


What’s inside:
- Gold extending, but has two key significant points which could stall rally
- Silver acting well, but has a lot of resistance to work through, still
- Price action dependent, pullbacks may soon be signaled
Traders have been buying the rally in gold, see the IG Client Sentiment page to find out what this could mean in the near-term; for a longer-term technical and fundamental outlook, see the Q1 Forecast.
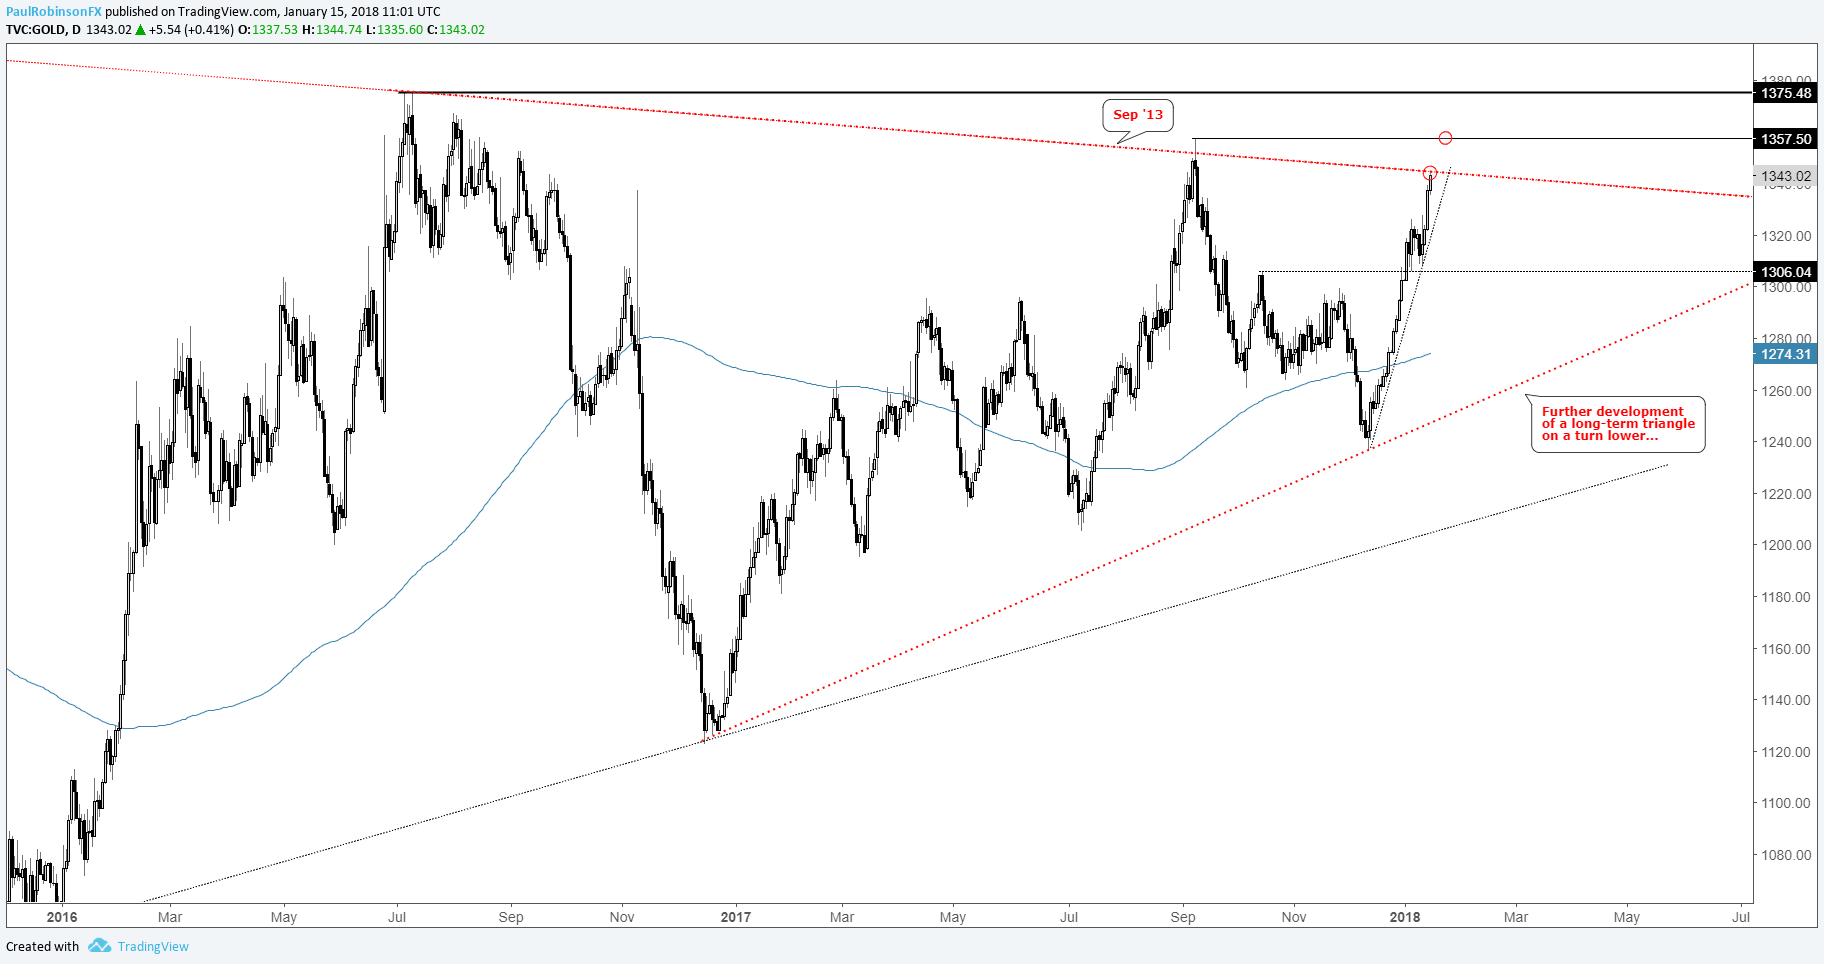
Gold continues to push higher with the help of a weak US dollar, now over $100 better than where it was a month ago. The recent extension has it trading at a trend-line dating back to 2013. The connecting points are important as one is the 2016 high and the other last year’s high.
If gold can overcome this significant hurdle, the next level is the 2017 high at 1357. A breakout beyond that point would be deemed important from the stand point of creating another higher-high since the rally began back in December 2016. This would leave room up to the 2016 high at 1375, an even bigger point of interest.
A scenario worth keeping in mind: If a reversal develops from around current levels we could see further development of a broad triangle formation dating back to mid-2016, with the 13-month underside trend-line as the bottom of the formation. From a big-picture perspective, this could be an explosive development.
For now, we’ll focus on how price action plays out at the aforementioned resistance levels and take it from there. You can join me on Tuesdays at 10:00 GMT for live in-depth technical analysis on precious metals and other commodities, along with equity indices.
Check out these 4 ideas for Building Confidence in Trading
Gold: Daily
Last week, silver held the trend-line off the December low, and is making another go at overcoming resistance. There is a price zone in the current vicinity up to 17.46, which is in confluence with the trend-line running down off the 2016 spike-high.
A breakout above these thresholds could spark momentum, with the next eyed line of resistance extending down from April, ~17.70. However, at the moment, silver is not only at resistance, but also lagging behind gold. This still leaves the burden of proof on buyers’ until a breakout above resistance can take shape.
Silver: Daily

---Written by Paul Robinson, Market Analyst
To receive Paul’s analysis directly via email – SIGN UP HERE
You can follow Paul on Twitter at @PaulRobinsonFX


