


What’s inside:
- Silver head-fake breakout higher then lower puts pressure on July trend-line
- A breakdown would be the ‘easier’ path, but respecting support until broken
- Gold could be undergoing construction of a broader triangle, keep an eye on the Dec t-line, 200-day MA
What is expected to drive Gold & Silver into year-end? To find out, check out the DailyFX Q4 Forecast.
On Friday, precious metals rallied sharply, with silver breaking out of a clean symmetrical triangle only to be swatted back lower to start the week. Price action around the apex of these types of patterns can be like that, volatile; after all, the contraction in price (volatility) points to an imminent increase in volatility, but doesn’t always offer clean directional indications upon the initial breakout.
At any rate, the top-side fake-out breakout puts the triangle at risk of breaking to the downside at the moment, but it’s too soon to say with conviction given it has yet to break and another knee-jerk could be in store. Besides, support is support until it isn’t. Adding weight to the underside trend-line of the pattern is that it extends back to July.
At this juncture, the ‘easiest’ path would be for a breakdown rather than rally, for three reasons. First, the head-fake initially came higher and a failed pattern break can lead to strong moves. Secondly, the breaking of the July trend-line would be important and likely lead to sustained selling. Third, but not least, it would be in the direction of the trend prior to the development of the congestion pattern. It's also all together possible a larger triangle forms, not an uncommon occurrence to see. In keeping things simple, focus at this time is on the lower trend-line and whether it will break or not.
Silver: Daily

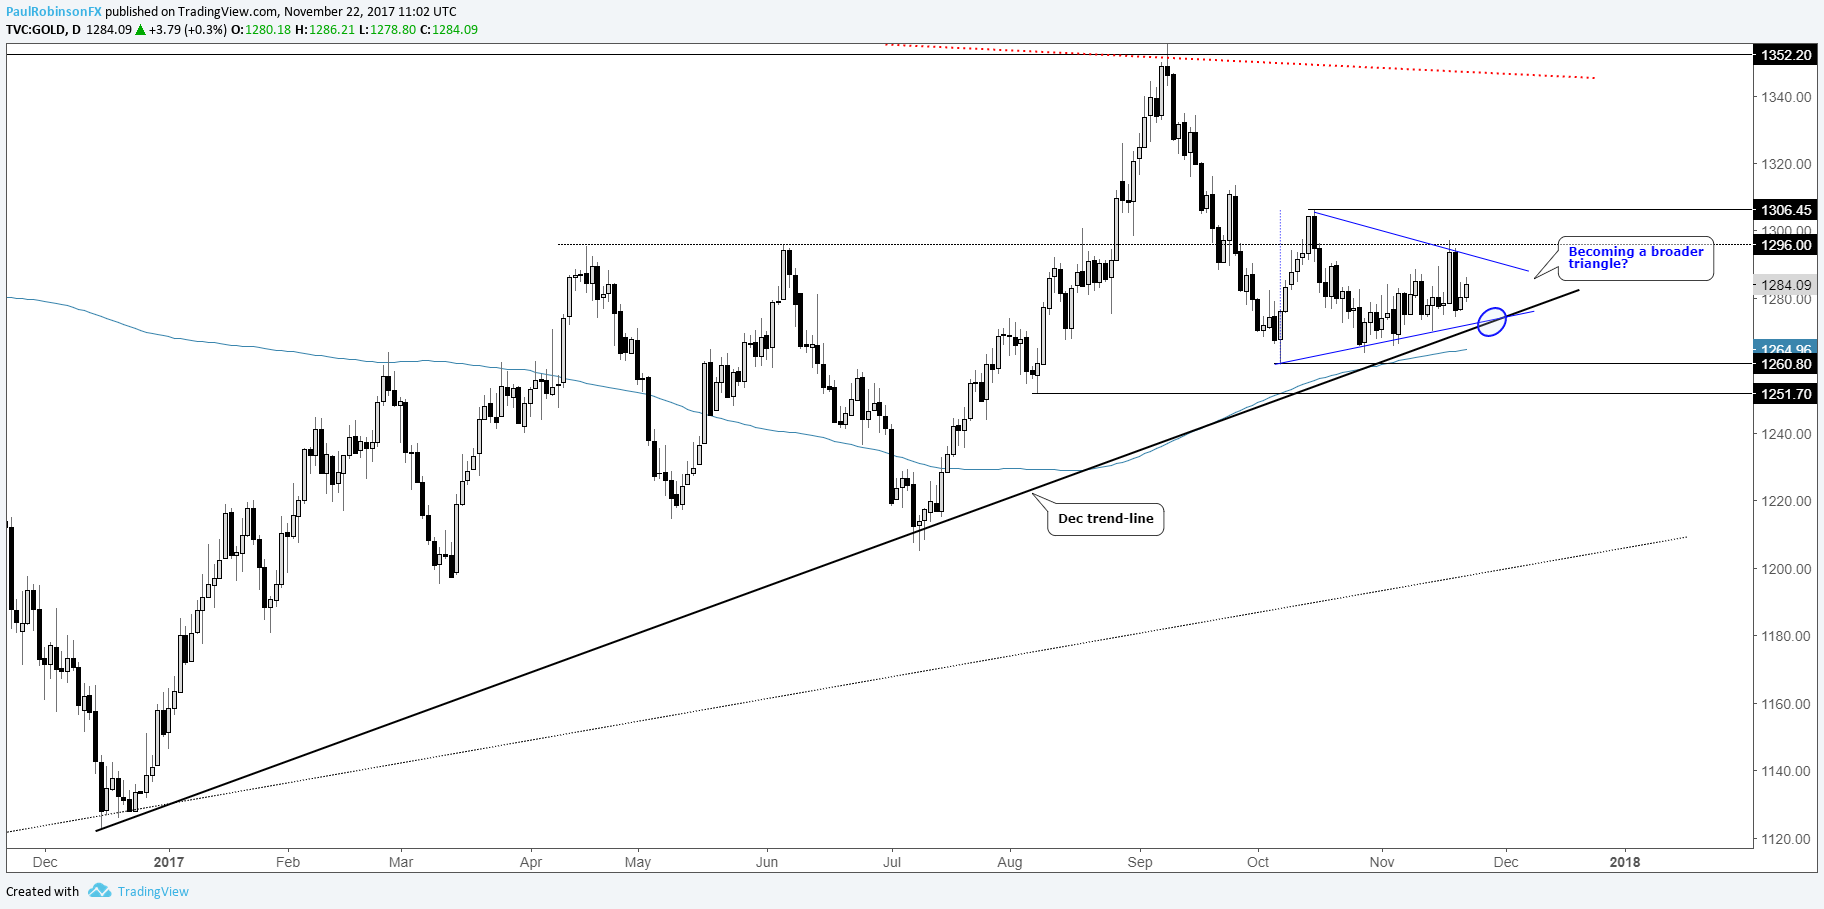
As we were saying last week in regards to gold, our preference is to look to silver for guidance given the cleaner price sequence. Gold has its own important trend-line, though, along with the 200-day MA. A break below the December trend-line and the long-term moving average would be in-line with the move off the September high and likely to provide the sharpest move. It’s possible a little shape-shifting is going on here and gold may be undergoing the construction of a broader triangle. More time will be needed to tell.
If all of this seems a little ‘wishy-washy’, it’s because markets in general are lacking clarity at the moment. For now, again, keeping an eye on those trend-lines (Silver, July; Gold, December) and with a little more time we should have a more decisive outlook.
Struggling right now, or just want to learn more about trading psychology? – Building Confidence in Trading.
Gold: Daily
---Written by Paul Robinson, Market Analyst
You can receive Paul’s analysis directly via email by signing up here.
You can follow Paul on Twitter at @PaulRobinonFX.


