


What’s inside:
- Gold trading around long-term trend-line, intermediate-term resistance too
- Silver trying to put in a key reversal around trend-line, carve out lower high
- US Dollar Index (DXY) at important long-term support zone
Find out in the Q3 Forecast what’s driving Gold & Silver this quarter.
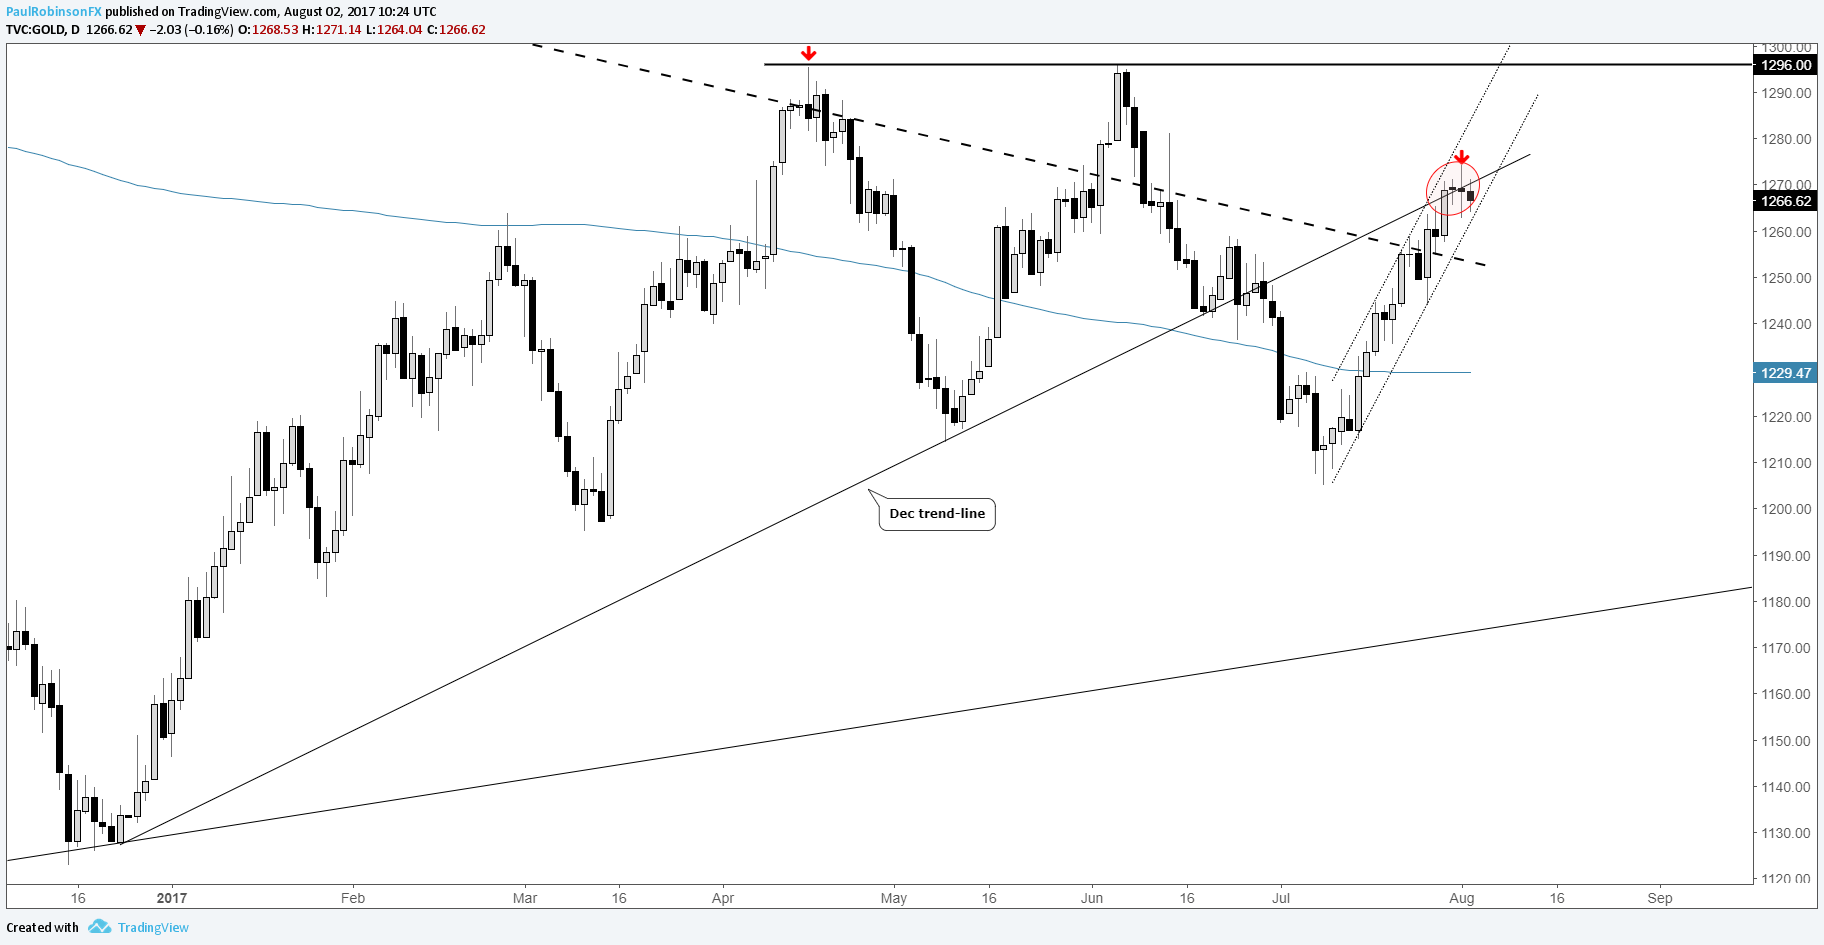
As we discussed in yesterday’s webinar, gold and silver prices are at important spots on their respective charts. We’ll start with gold and then move onto silver. Gold is trading around (a little above) the widely-watched 2011 trend-line. It’s an important line-in-the-sand, one which has been highly influential for over a year. As we’ve noted on numerous occasions a strong, convincing weekly close above the long-term threshold is needed to spur conviction from the long-side. At this point, in our book, a higher high above the April/June double-top at 1296 is needed to tilt the chart truly positive. That’s the broad lay of the land.
Gold: Weekly

Looking closer, gold is trying to turn lower from the underside of the December 2016 trend-line. Yesterday, price action resulted in a ‘doji’ daily candle with a fairly sizable range, indicating potential exhaustion (A candlestick formation we discussed last week).
Daily
For purposes of clarity, we’ll drill down one more time-frame to see when selling may pick up. On the 4-hr we can see the nice, neat channel gold has been travelling upwardly in. A break below the lower parallel will be our cue to look for increased selling pressure.
4-hr

Want to get involved in one of our upcoming live events? See the Webinar Calendar for details.
Silver doesn’t have a long-term threshold at hand like gold does, but still nevertheless it’s trading at an important spot, and depending on how the daily bar looks by the end of the day we could have the type of price action (key reversal bar) which signals the end of the run off last month’s low. Putting the rally into perspective, it’s occurred within the context of a downtrend marked by clear lower highs and lower lows. A turn lower soon could mark yet another lower high. The 2003 trend-line remains the target on another downdraft.
Silver: Daily

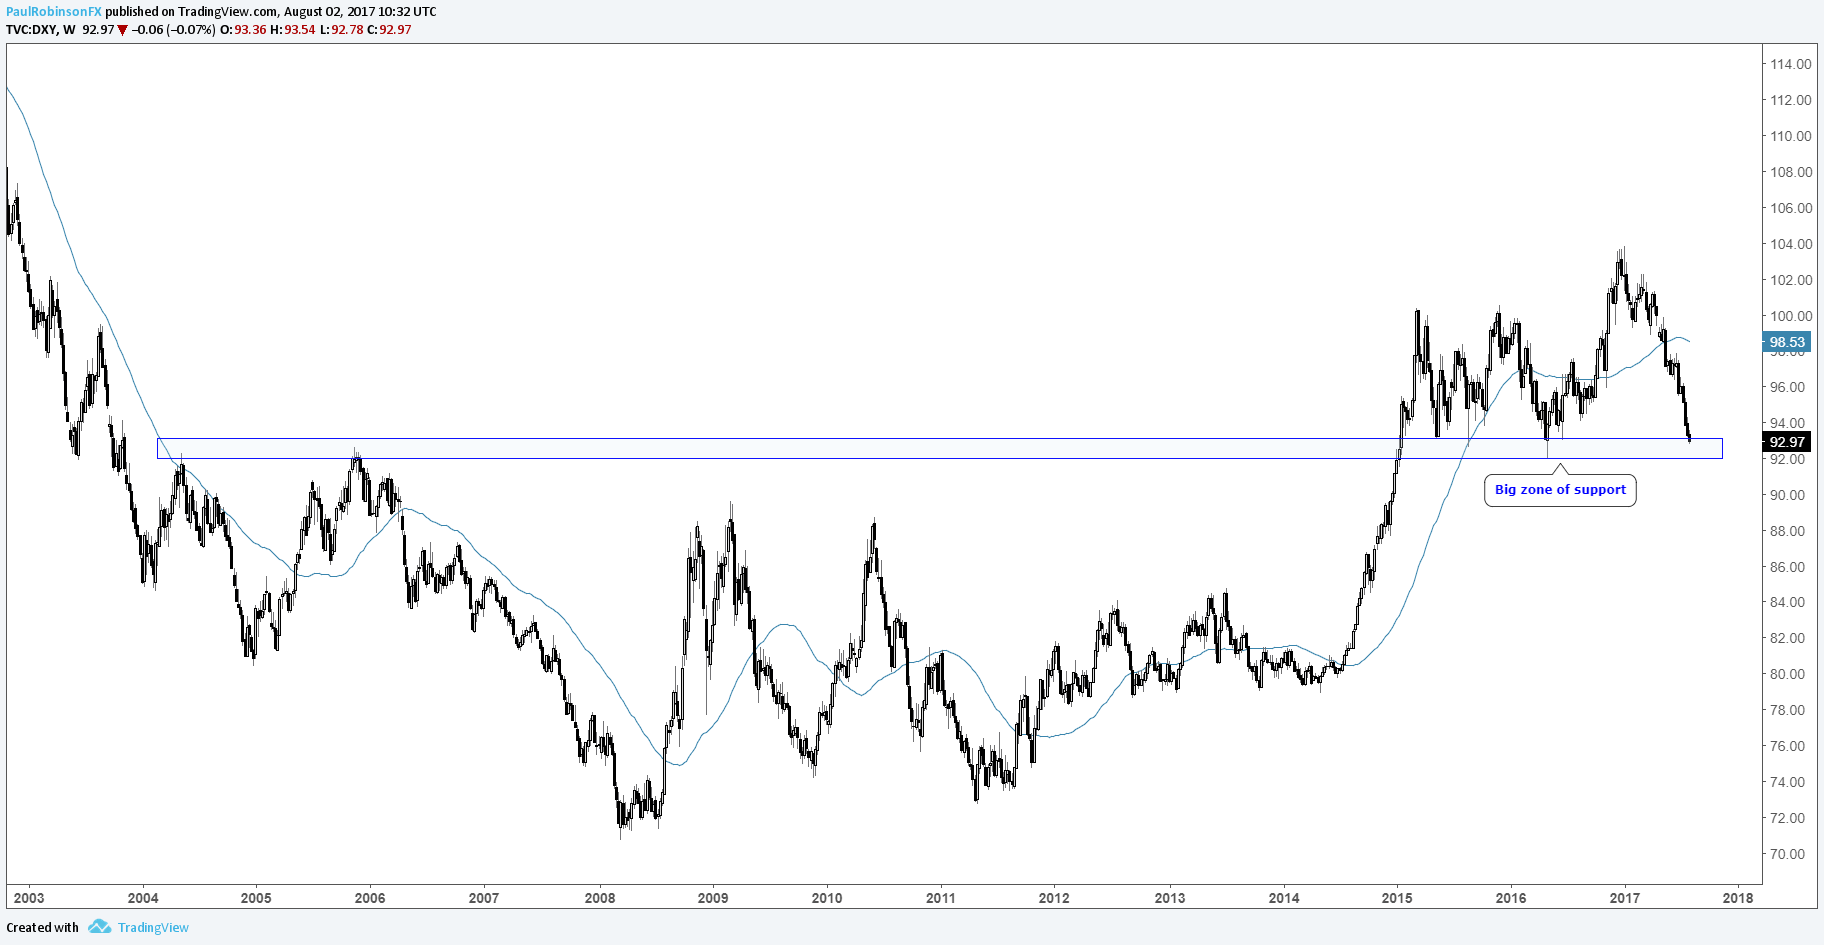
The U.S. Dollar Index (DXY) is coming up on a very big zone of support extending back to 2015 (was big resistance back in 2004/05). The inverse correlation between precious metals and the dollar has been strong, and on that a big turn in the buck, as long as the relationship stays intact, could spur selling in precious metals.
US Dollar Index (DXY): Weekly
Heads up: NFP Friday is coming up. The consensus estimate is for the economy to have added 180k jobs last month followed by an increase of 222k in June. Any outsized deviation from expectations is almost certain to move markets.
---Written by Paul Robinson, Market Analyst
You can receive Paul’s analysis directly via email by signing up here.
You can follow Paul on Twitter at @PaulRobinonFX.


