


Talking Points
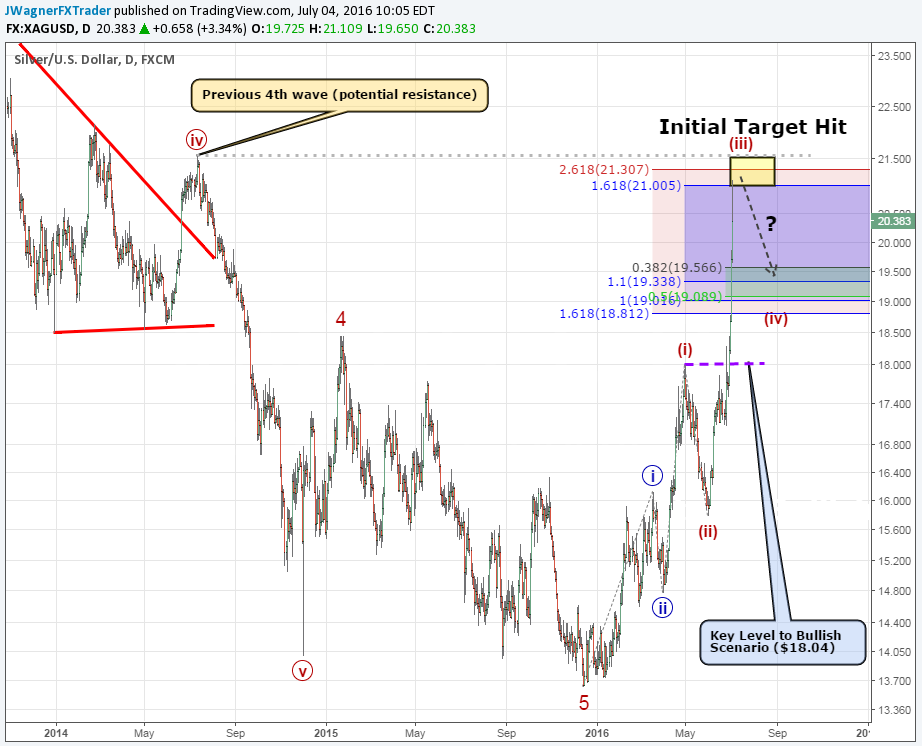
-Silver prices hit initial target with today’s intraday high of $21.17
-Risk can be set near May 2 high of $18.04
-Anticipate sideways to lower trade as these strong gains may be consolidated
Silver prices printed $21 intraday for the first time since July 2014 as the Brexit vote has traders anticipating more central bank easing. Lower interest rates make metals like silver and gold generally more attractive. With silver prices poised to finish higher 5 sessions in a row, you would think they just won the Miss Universe contest.
However, later this week we have the US non-farm payrolls printing. Though the market is pricing in a very low probability of a rate hike in 2016, a strong NFP number may cause some repricing of future rate hikes and perhaps taper some of silver’s growth.
Silver prices have some technical headwinds to contend with. Two main areas we’ll discuss further below is:
- Measured wave relationships near $21.00-21.50
- Previous 4th wave near $21.60
When viewing the XAG/USD chart,$21-21.50 is an area of potential resistance that may slow down increases and make it difficult for strong continued gains in the short term.
“Much above $19.33…and we can set our sights on the next level of measured resistance near $21.05-$21.50. Risk to the immediate bullish outlook can be placed near the May 2 swing high of $18.04.”
Friday afternoon did break above $19.33 so we can move our medium term risk level to $18.04. A move below $18.04 suggests that a medium term to longer term high is in place.
Additionally, today’s intraday high is $21.17 where prices subsequently spiked lower. It is possible that prices may dip back to the $19.00-19.50 price zone. This price zone could be an area to buy the dip as it was a former break out level.
After having 2 weeks of strong moves higher, silver prices are at risk of a meaningful pull back. On a more bearish note, a previous 4th wave (which is a common retracement level) is the July 2014 high of $21.60. Though future gains are possible, one has to consider the possibility of the shorter term trend consolidating from near current levels.
Bottom line, the train has left the station so new bulls may want to consider waiting for a dip towards $19.00-19.50. The risk for bulls is $18.04.
If the medium term to longer term top is in place, then we’ll reconsider our wave labels on a break below $18.04.
Having trouble trading silver? This may be why.
Interested in a quarterly outlook for Gold. Check it out here.
---Written by Jeremy Wagner, Head Trading Instructor, DailyFX EDU
Follow me on Twitter at @JWagnerFXTrader .
See Jeremy’s recent articles at his Bio Page.
To receive additional articles from Jeremy via email, join Jeremy’s distribution list.


