


Crude Oil Outlook:
- Crude oil prices briefly broke out of their consolidation before returning today.
- Conflicting news about the end of China’s zero-COVID strategy have global growth concerns back in focus.
- According to the IG Client Sentiment Index, crude oil prices have a mixed bias in the near-term.
Trade Smarter - Sign up for the DailyFX Newsletter
Receive timely and compelling market commentary from the DailyFX team
Fundamental Factors Continue to Conflict
Crude oil prices are experiencing just their second day in the red for November, having been met by a flurry of conflicting headlines about the state of the global economy. While news broke over the weekend that Chinese government officials were considering winding down the country’s zero-COVID strategy, a fresh wave of increased infection rates across Chinese cities has lockdowns back in focus. US economic indicators are still pointing to a weakening economy while the Eurozone and UK continue to face difficult growth circumstances. For now, the breakout that crude oil prices saw gathering pace at the end of last week and the start of this one has been put on hold.

Oil Volatility, Oil Price Correlation Still Weak
Crude oil prices have a relationship with volatility like most other asset classes, especially those that have real economic uses – other energy assets, soft and hard metals, for example. Similar to how bonds and stocks don’t like increased volatility – signaling greater uncertainty around cash flows, dividends, coupon payments, etc. – crude oil tends to suffer during periods of higher volatility. Crude oil volatility’s further drop has only recently been met with a decline in oil prices.
OVX (Oil Volatility) Technical Analysis: Daily Price Chart (November 2021 to November 2022) (Chart 1)

Oil volatility (as measured by the Cboe’s gold volatility ETF, OVX, which tracks the 1-month implied volatility of oil as derived from the USO option chain) was trading at 52.06 at the time this report was written. The 5-day correlation between OVX and crude oil prices is +0.20 while the 20-day correlation is -0.32. One week ago, on November 1, the 5-day correlation was +0.52 and the 20-day correlation was +0.56.

Crude Oil Price Technical Analysis: Daily Chart (November 2021 to November 2022) (Chart 2)
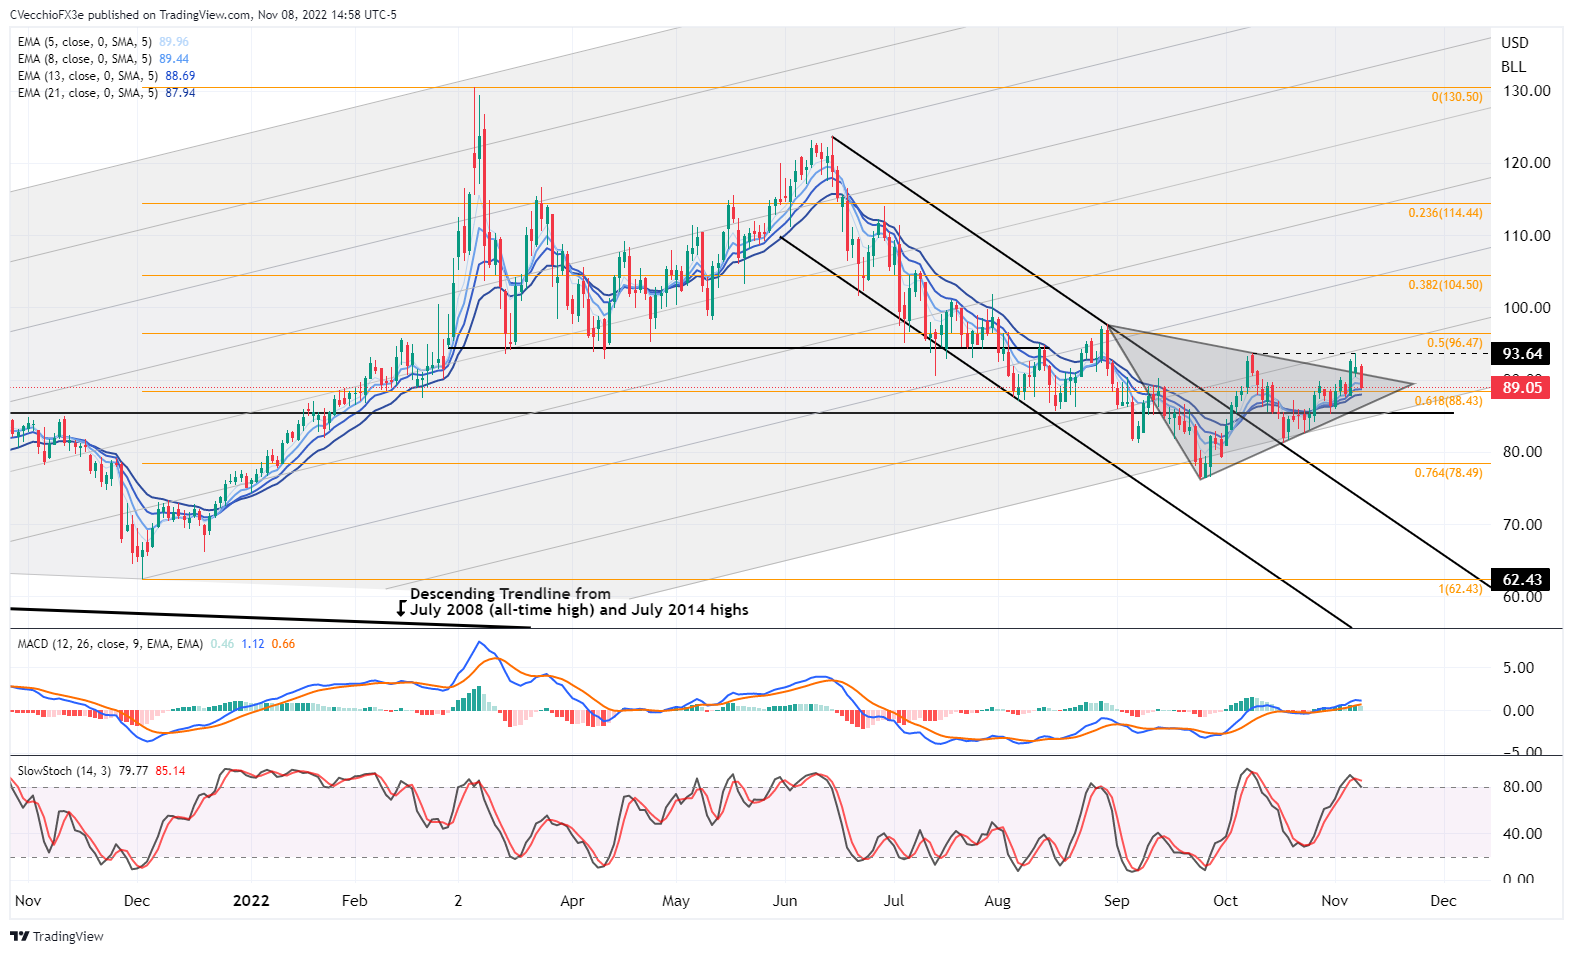
Last week it was noted that “while further sideways consolidation may take place over the next few weeks – the terminal point of the triangle doesn’t arrive until mid-November – contextually, the breakout from the downtrend from the June and August highs coupled with the recent consolidation suggests that traders should be on alert for a topside breakout.”
Indeed, crude oil prices attempted a topside breakout last week, only to run into the October high yesterday before turning lower. Now, crude oil prices are back within their multi-month symmetrical triangle, suggesting the bullish impulse has initially failed. Momentum retains a bullish tilt, however. Crude oil prices are above their daily 5-, 8-, 13-, and 21-EMAs, and the EMA envelope is in bullish sequential order. Daily MACD is still rising above its signal line, while daily Slow Stochastics are holding overbought territory. Triangle support comes in near 86.50, which if broken, could signal a deeper setback for crude oil prices. Otherwise, more consolidation may be ahead.
Crude Oil Price Technical Analysis: Weekly Chart (March 2008 to November 2022) (Chart 3)

Nothing has changed: “momentum is neutralizing on the weekly timeframe. Crude oil prices are back above their weekly 4-EMA, holding exactly at their weekly 13-EMA, and are still below their weekly 26-EMA; the EMA envelope remains in bearish sequential order. Weekly MACD is turning higher albeit still below its signal line, while weekly Slow Stochastics are back above their median line…a weekly close above the weekly 26-EMA…would help reinforce the bullish technical reversal narrative, suggesting it’s too soon to take a longer-term directional bias.”

IG CLIENT SENTIMENT INDEX: CRUDE OIL PRICE FORECAST (November 8, 2022) (CHART 4)
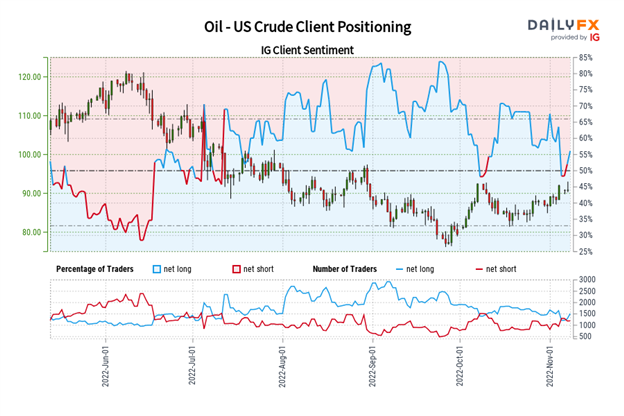
Oil - US Crude: Retail trader data shows 57.77% of traders are net-long with the ratio of traders long to short at 1.37 to 1. The number of traders net-long is 6.10% higher than yesterday and 7.09% lower from last week, while the number of traders net-short is 12.66% lower than yesterday and 16.48% higher from last week.
We typically take a contrarian view to crowd sentiment, and the fact traders are net-long suggests Oil - US Crude prices may continue to fall.
Positioning is more net-long than yesterday but less net-long from last week. The combination of current sentiment and recent changes gives us a further mixed Oil - US Crude trading bias.
Trade Smarter - Sign up for the DailyFX Newsletter
Receive timely and compelling market commentary from the DailyFX team
--- Written by Christopher Vecchio, CFA, Senior Strategist


