


Crude Oil Outlook:
- Global recession fears continue to lingeras China’s zero-COVID strategy continues and US economic indicators point to a slowdown in the coming months.
- Crude oil prices are funneling into a symmetrical triangle which may persist into mid-November.
- According to the IG Client Sentiment Index, crude oil prices have a mixed bias in the near-term.
Conflicting Fundamental Factors
Crude oil prices had a strong October (+8.86% last month) and have had a positive start to November (+2.55% at the time of writing), but thus far, it’s too soon to say that energy markets are out of the proverbial woods.
Global recession concerns are lingering, as China’s zero-COVID strategy continues and US economic indicators point to a slowdown in the coming months – never mind the multiplicity of issues that the Eurozone and the UK are facing.
This negativity has been offset to a degree by the OPEC+ decision to curtail production over the coming months. But on balance, it’s led to a sideways, rangebound environment for crude oil prices that appears likely to persist for the foreseeable future.

Oil Volatility, Oil Price Correlation Weakens
Crude oil prices have a relationship with volatility like most other asset classes, especially those that have real economic uses – other energy assets, soft and hard metals, for example. Similar to how bonds and stocks don’t like increased volatility – signaling greater uncertainty around cash flows, dividends, coupon payments, etc. – crude oil tends to suffer during periods of higher volatility. Crude oil volatility dropping has not been met with a similar decline in oil prices.
OVX (Oil Volatility) Technical Analysis: Daily Price Chart (November 2021 to November 2022) (Chart 1)
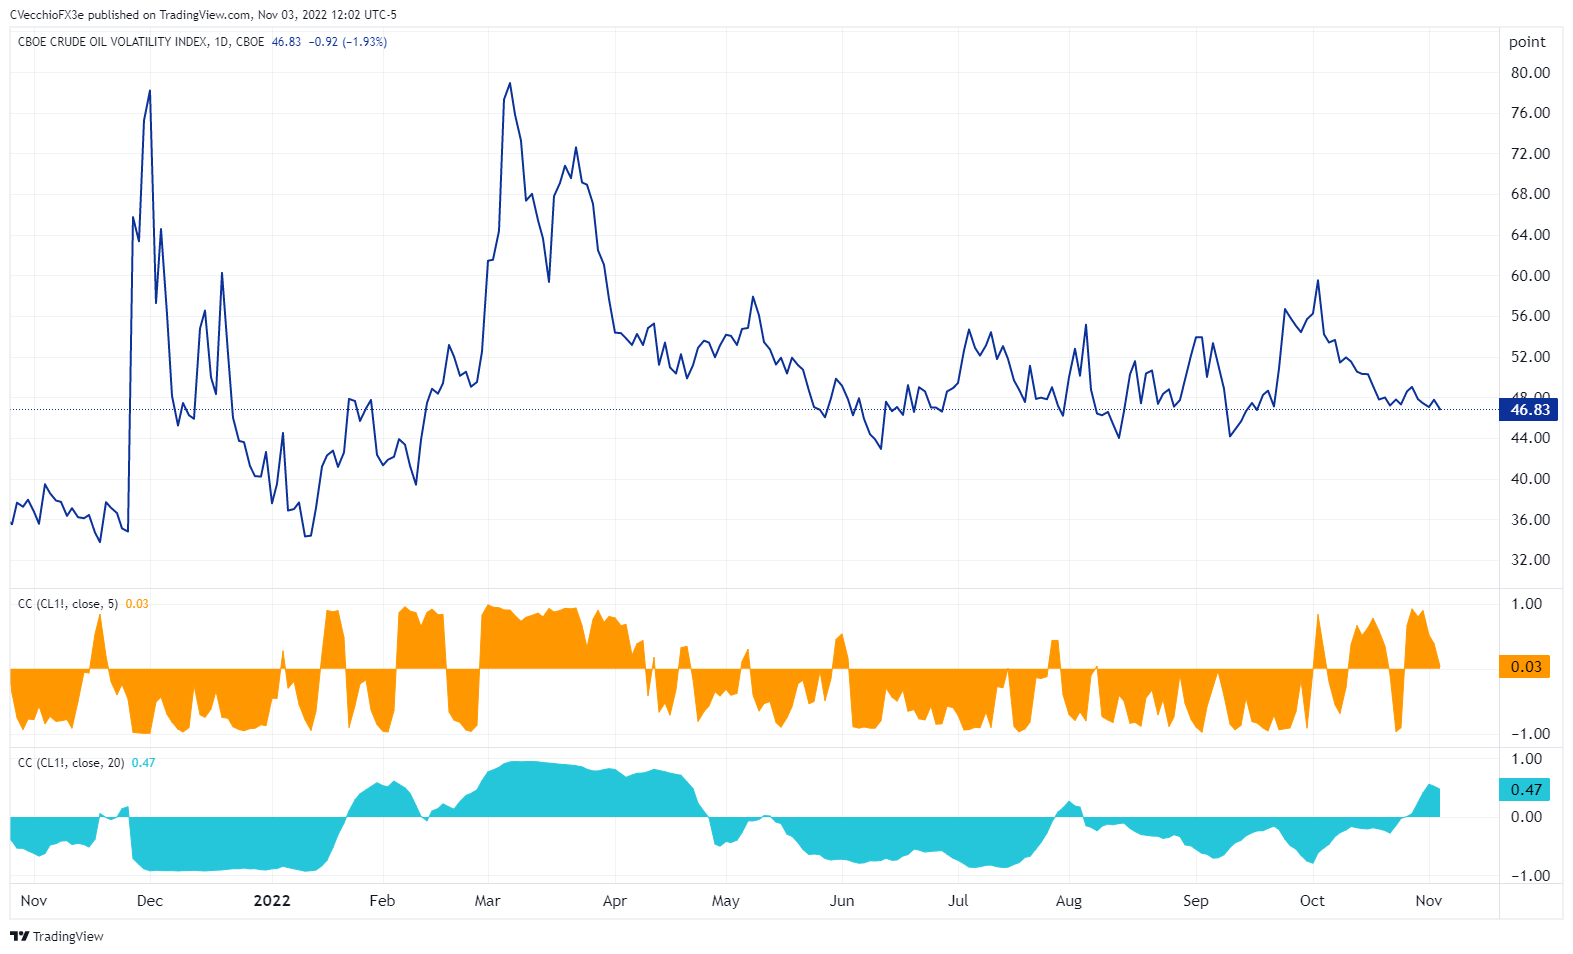
Oil volatility (as measured by the Cboe’s gold volatility ETF, OVX, which tracks the 1-month implied volatility of oil as derived from the USO option chain) was trading at 52.06 at the time this report was written. The 5-day correlation between OVX and crude oil prices is +0.03 while the 20-day correlation is +0.47. One week ago, on October 27, the 5-day correlation was +0.92 and the 20-day correlation was +0.05.

Crude Oil Price Technical Analysis: Daily Chart (November 2021 to November 2022) (Chart 2)

When we last checked in on crude oil prices in mid-October, it was noted that “more choppy, sideways trading could be ahead; no significant strength nor weakness is expected to transpire.” Indeed, that’s what has played out over the past two weeks, with crude oil prices continuing to funnel into a symmetrical triangle that started to take shape at the end of August.
Momentum does have a bullish hue, however. Crude oil prices are above their daily 5-, 8-, 13-, and 21-EMAs, and the EMA envelope is in bullish sequential order. Daily MACD is rising above its signal line, while daily Slow Stochastics have reached overbought territory.
While further sideways consolidation may take place over the next few weeks – the terminal point of the triangle doesn’t arrive until mid-November – contextually, the breakout from the downtrend from the June and August highs coupled with the recent consolidation suggests that traders should be on alert for a topside breakout.
Crude Oil Price Technical Analysis: Weekly Chart (March 2008 to November 2022) (Chart 3)

Momentum is neutralizing on the weekly timeframe. Crude oil prices are back above their weekly 4-EMA, holding exactly at their weekly 13-EMA, and are still below their weekly 26-EMA; the EMA envelope remains in bearish sequential order. Weekly MACD is turning higher albeit still below its signal line, while weekly Slow Stochastics are back above their median line. As noted last week, “a weekly close above the weekly 26-EMA…would help reinforce the bullish technical reversal narrative,” suggesting it’s too soon to take a longer-term directional bias.

IG CLIENT SENTIMENT INDEX: CRUDE OIL PRICE FORECAST (November 3, 2022) (CHART 4)

Oil - US Crude: Retail trader data shows 61.83% of traders are net-long with the ratio of traders long to short at 1.62 to 1. The number of traders net-long is 8.15% lower than yesterday and 2.52% lower from last week, while the number of traders net-short is 2.19% lower than yesterday and 14.40% lower from last week.
We typically take a contrarian view to crowd sentiment, and the fact traders are net-long suggests Oil - US Crude prices may continue to fall.
Positioning is less net-long than yesterday but more net-long from last week. The combination of current sentiment and recent changes gives us a further mixed Oil - US Crude trading bias.
Trade Smarter - Sign up for the DailyFX Newsletter
Receive timely and compelling market commentary from the DailyFX team
--- Written by Christopher Vecchio, CFA, Senior Strategist


