Crude Oil Technical Highlights:
- WTI was hit extremely hard last week, bringing into question the broader trend
- The recent peak could mark a major lower-high scenario if it can’t hold soon
- A pair of trend-lines could hold the key in the near-term


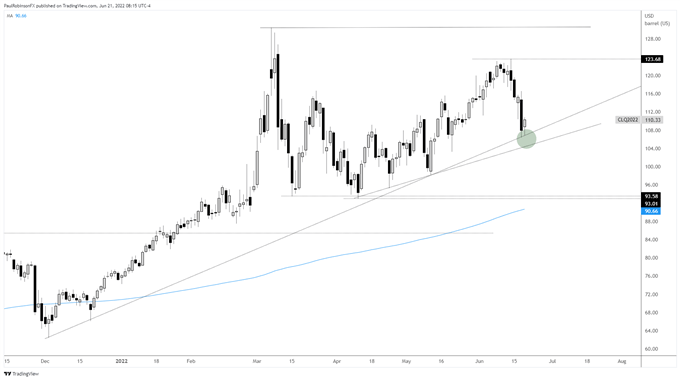
WTI crude oil (CL) rolled over hard last week, suffering some of its worst losses in a while. The decline comes after nearing the spike-high created in March, which brings into question whether the recent rise was a failed test of the March high.
Often times significant turning points are either fully tested (or slightly breached) or find the retest run falling short to create a lower-high (or higher-low if a bottom). With that in mind, March’s nasty monthly reversal was a candidate for such a series to play out.
Now that we are seeing price roll over the likelihood we have a lower-high in place has risen sharply, and on that what happens next will be very important. There is still some trend support in place from December and April, and on that we may see oil soon stabilize.
If it can, then oil could continue to carve out a range for a period of time that either then leads to a continuation pattern or a breakdown that still validates March as a major high. If, however, we see more selling take out trend support then WTI looks poised to trade to the April lows or worse.
That would require a drop to the 92s, which would also likely coincide with a test of the 200-day that is quickly rising up. It currently sits at 90.66. This could hold as the bottom part of a large range, but given the sequence of spike-high and retest, it would seem likely that oil has entered a period where it will decline for some time.
For now, the focus is on whether oil can hold the trend-lines from December and April. We are seeing some early week strength from the area, but will need to see sizable buying pressure come in if it is to stick as something more meaningful.


Crude Oil (CL1!) Daily Chart

WTI Crude Oil Chart by TradingView
Resources for Forex Traders
Whether you are a new or experienced trader, we have several resources available to help you; indicator for tracking trader sentiment, quarterly trading forecasts, analytical and educational webinars held daily, trading guides to help you improve trading performance, and one specifically for those who are new to forex.
---Written by Paul Robinson, Market Analyst
You can follow Paul on Twitter at @PaulRobinsonFX


