


Crude Oil Technical Outlook
- The market adjusted between fears and hopes
- Brent oil price chart exposes a reversal signal
Brent Price- Bulls Pullback
Last week, the Brent oil hit a four and a half-month high of $45.01. However, the price retreated after as some bulls seemed to cut back. Ultimately, a weekly candlestick closed in the green with a 1.1% gain. Alongside that, the Relative Strength Index (RSI) fell from 67 to 57 highlighting a weaker bullish momentum.
Factors like weaker US dollar price and positive news about the Coronavirus vaccine were behind moving the Brent oil higher, while the rising cases of COVID-19 in the US and elsewhere sparked fears over the global demand and limited the positive price move.
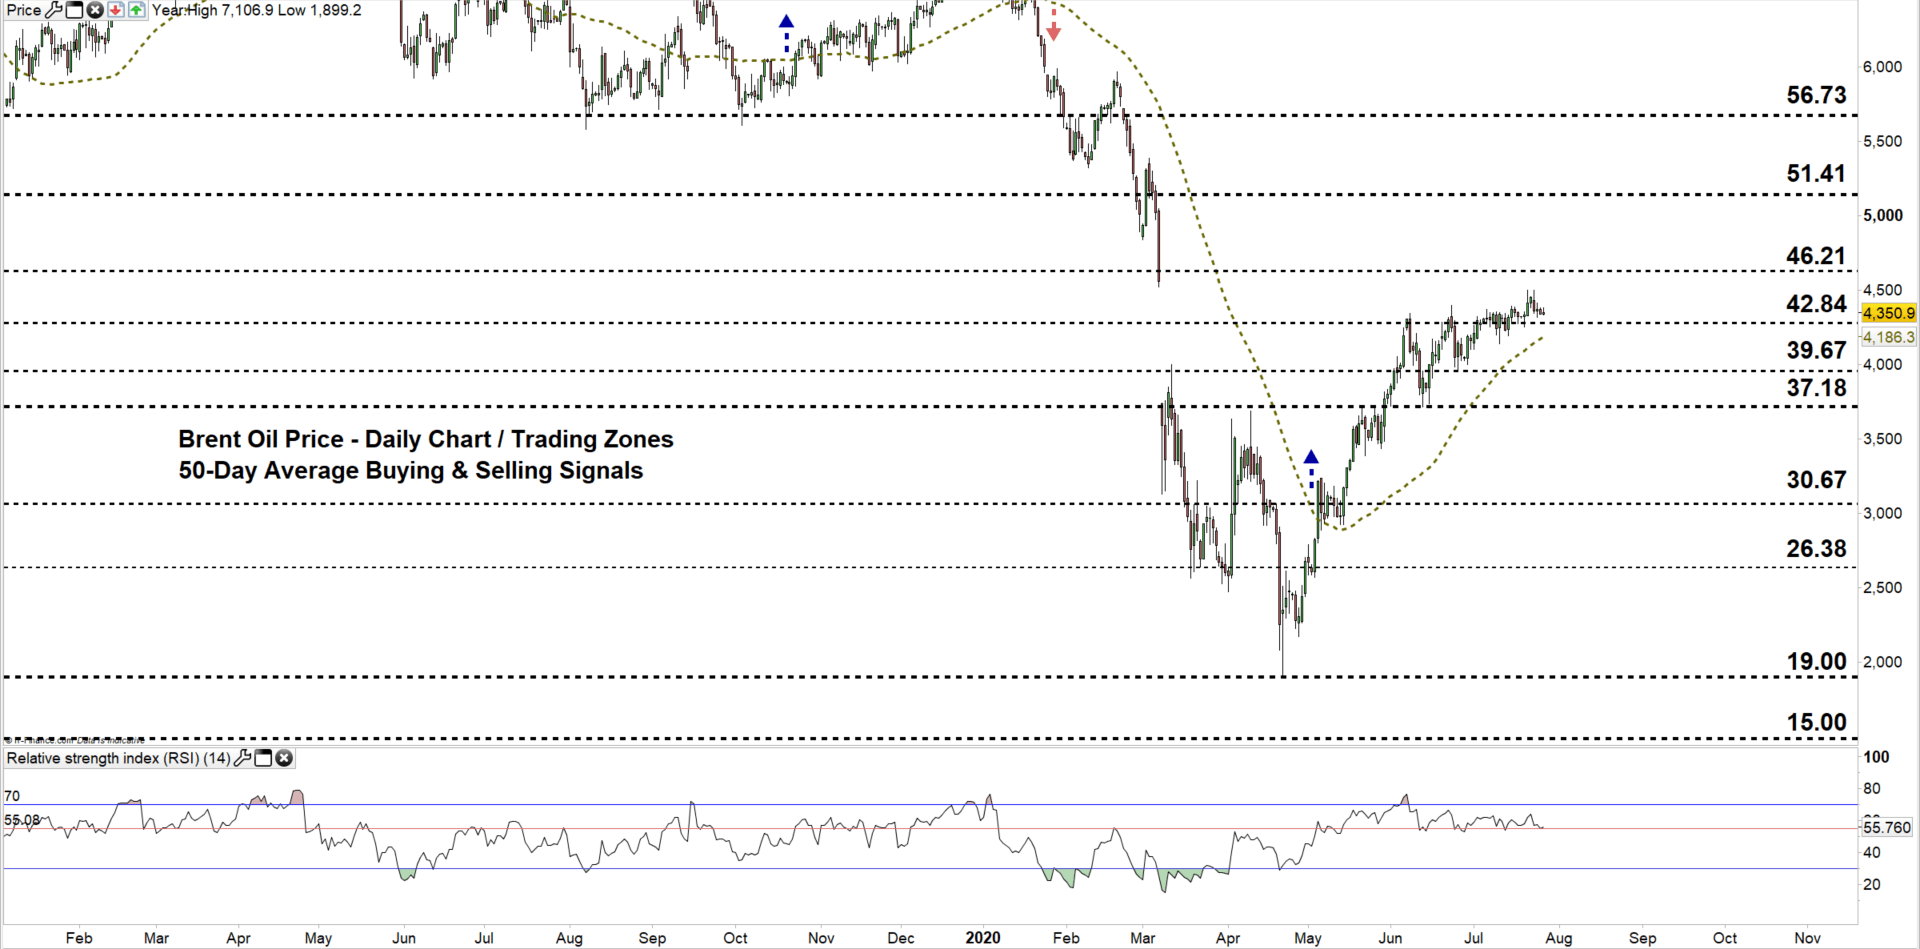
Brent Oil DAILY PRICE CHART (Feb 1, 2019 – July 27, 2020) Zoomed Out

Brent Oil DAILY PRICE CHART (May 15 – July 27, 2020) Zoomed IN

On July 14, the Brent climbed to the current $42.84 - $46.21 trading zone. As we see on the daily chart the price failed on multiple occasions to break through the lower trading zone indicating that bullish momentum remained intact.
However, it’s important to note the price and RSI divergence as the former created a higher high, while the latter created a lower high, signaling a possible reversal of the upward trend.
A daily close below the low end of the current trading zone may ultimately guide the price fall towards the monthly support at $39.68( December 2015 high).
Meanwhile, a daily close above the high end of the zone could encourage bulls to rally the Brent towards the monthly resistance at $51.41 (February 2015 low).

Brent Oil Four-Hour PRICE CHART (June 24 – July 27, 2020)
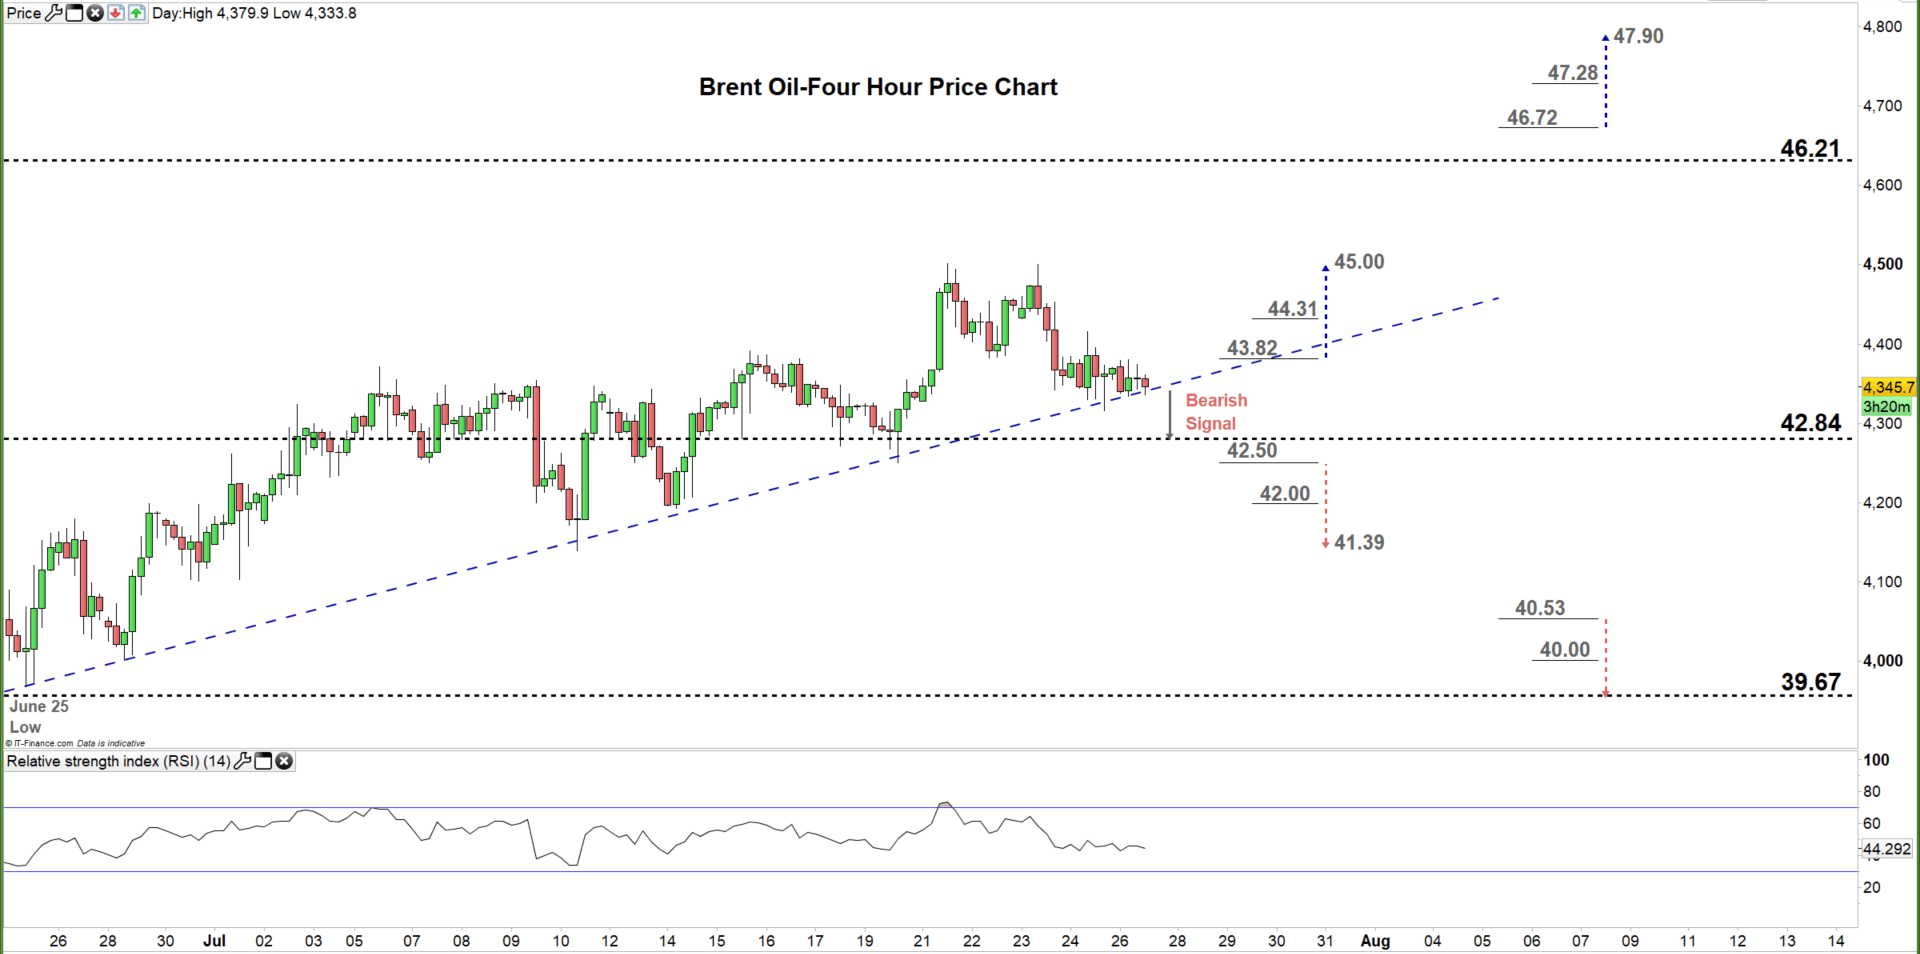
On Friday, Crude oil rebounded from the bullish trendline support originated from the June 25 low at $39.68, reflecting that bulls still in charge. That said, a break below that trendline may keep the bearish potential alive.
To conclude, while the bullish bias is still in place, the price/RSI divergence provides a good base of a possible reversal. Therefore, a break below the July 20 low at $42.50 could the Brent oil price towards $41.39, while a break above the July 22 low at $43.82 may trigger a rally towards $45.00 handle. As such, the daily support and resistance levels underlined on the four-hour chart should be watched closely.
Written By: Mahmoud Alkudsi, Market Analyst
Please feel free to contact me on Twitter: @Malkudsi


