CRUDE OIL PRICE OUTLOOK: OPEC+ CALL LEAVES SAUDI ARABIA, RUSSIA PRODUCTION CUTS IN QUESTION
- Crude oil price action clashes with technical resistance following the latest OPEC+ call
- Saudi Arabia shied away from committing to sustained oil production cuts
- Russia’s energy minister also casted doubt over keeping supply curbed beyond July
Crude oil prices are struggling to continue their rally as the commodity runs into a key technical obstacle and fails to find a fundamental boost from the latest OPEC+ meeting. A phone call held by oil cartel officials ultimately revealed that Saudi Arabia and Russia, two of the world’s largest crude oil producers, though committed to current supply cuts, have limited appetite to extend the OPEC+ deal in effect until June.
| Change in | Longs | Shorts | OI |
| Daily | -6% | 4% | -3% |
| Weekly | 15% | -24% | 0% |
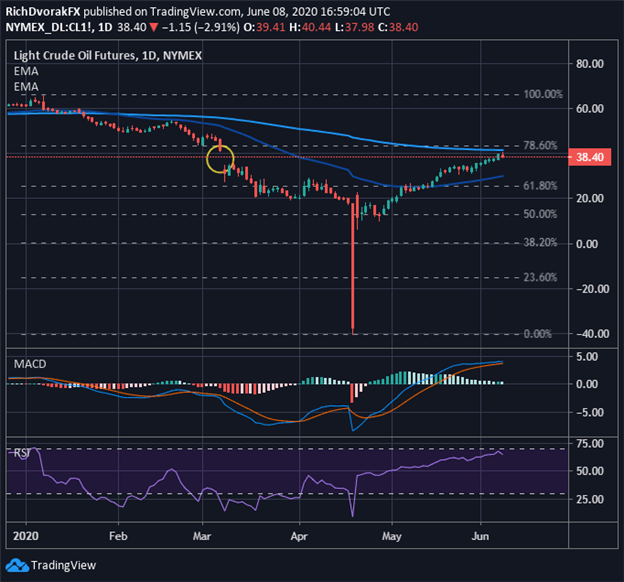
CRUDE OIL PRICE CHART: DAILY TIME FRAME (26 DEC 2019 TO 08 JUN 2020)

Chart created by @RichDvorakFX with TradingView
Crude oil price action has started to slump as the commodity encroaches upon its 200-day exponential moving average. This zone of technical confluence is also underpinned by its 78.6% Fibonacci retracement level of the year-to-date trading range.
Moreover, the relative strength index shows signs of pivoting lower and reflects that the healthy bullish trend could face headwinds going forward with crude oil trading near ‘overbought’ territory. Not to mention, the 09 March 2020 gap lower presents a daunting level of technical resistance.


That said, there is potential that crude oil prices edge lower toward the 50-day moving average and 61.8% Fib level. Conversely, a relentless bid under risk assets, largely fueled by coronavirus optimism around the global economy reopening from lockdown measures that paralyzed business activity and demand for crude oil, could help WTI prices continue melting higher.
Nevertheless, considering the lack of an extended OPEC+ deal that sustains recent supply cuts, and seeing that crude oil demand likely remains materially below pre-coronavirus pandemic levels amid the gradual scaling back of coronavirus lockdown measures, crude oil price action could struggle to continue its climb.
Keep Reading – S&P 500 Surges as VIX ‘Fear-Gauge’ Implodes Post-Jobs Report
-- Written by Rich Dvorak, Analyst for DailyFX.com
Connect with @RichDvorakFX on Twitter for real-time market insight


