


CRUDE OIL FORECAST: OIL PRICE CHART PROBES TECHNICAL SUPPORT AS VOLATILITY & CORONAVIRUS FEARS FADE
- Crude oil price action ricochets off the 49.00 handle as the commodity catches bid alongside fading volatility and return of risk appetite ahead of an OPEC meeting next week
- WTI and Brent oil could rebound with short-term technical indicators suggesting spot prices are starting to point higher after sliding about 10% over the last five trading sessions
- Oil prices likely hinge on economic fallout from the novel coronavirus outbreak and corresponding hit to crude oil demand
Oil is starting to show signs of a potential rebound attempt. This comes after a sharp drop in the price of crude oil – about 10% from the February 20 intraday high to the February 26 intraday low – due to rising market uncertainty and fear over the novel coronavirus outbreak.
Learn more – How to Trade Oil: Crude Oil Trading Strategies and Tips
The brewing coronavirus pandemic is paralyzing global economic activity as it spreads across China and abroad, which has rekindled recession odds and dealt a major blow to expected demand for crude oil.
As virus fears abate, however, crude oil price action has potential to recover recent downside alongside a retracement in volatility and improving risk appetite.
CRUDE OIL PRICE CHART: 1-HOUR TIME FRAME (FEBRUARY 19 TO FEBRUARY 26)
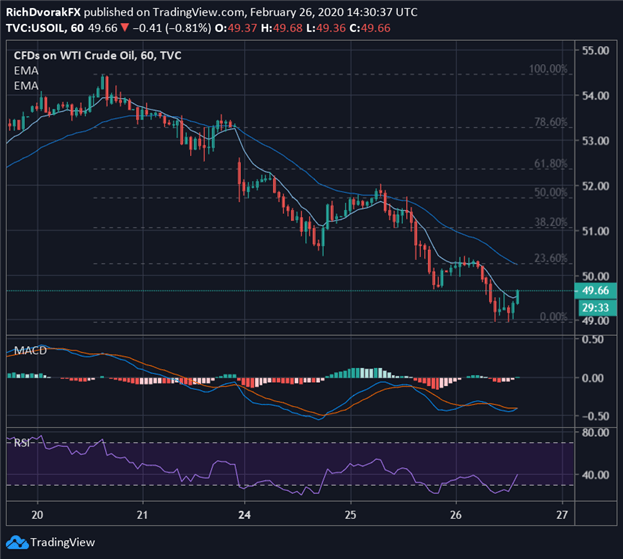
Chart created by @RichDvorakFX with TradingView
An hourly crude oil chart shows the slow-and-steady churn lower in petroleum prices over the last few trading days with the commodity recording a series of lower lows and lower highs.
Yet, oil prices look like they might be perking up after finding short-term technical support around the 49.00 handle.
| Change in | Longs | Shorts | OI |
| Daily | 1% | 6% | 2% |
| Weekly | 1% | -20% | -6% |
Positive divergence indicated by the MACD and RSI are likely encouraging technical developments for crude oil bulls. Holding above the 9-hour exponential moving average could provide a healthy tailwind that facilitates a broader rebound in WTI and Brent oil.
Learn more – WTI vs Brent: Top 5 Differences Between WTI and Brent Crude Oil
The longer-term downtrend may nevertheless continue dominating crude oil price action. On that note, the 34-hour EMA and confluent resistance near the 50.50 price level have potential to hinder a prolonged rebound in oil prices.
CRUDE OIL PRICE CHART: DAILY TIME FRAME (SEPTEMBER 2019 TO FEBRUARY 2020)
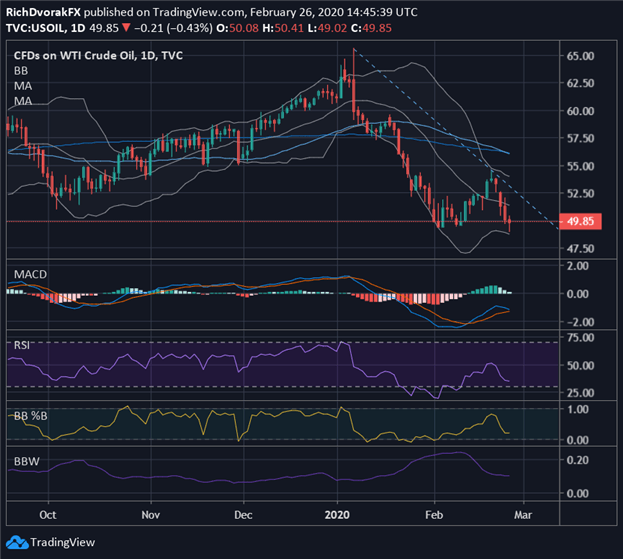
Chart created by @RichDvorakFX with TradingView
If crude oil price action fails to recoil higher, the commodity could snap back lower to retest the February lows. This bearish scenario could grow more probable if there is another sudden jolt of risk aversion and surge in volatility.
VIX INDEX & CRUDE OIL PRICE CHART: DAILY TIME FRAME (AUGUST 2019 TO FEBRUARY 2020)
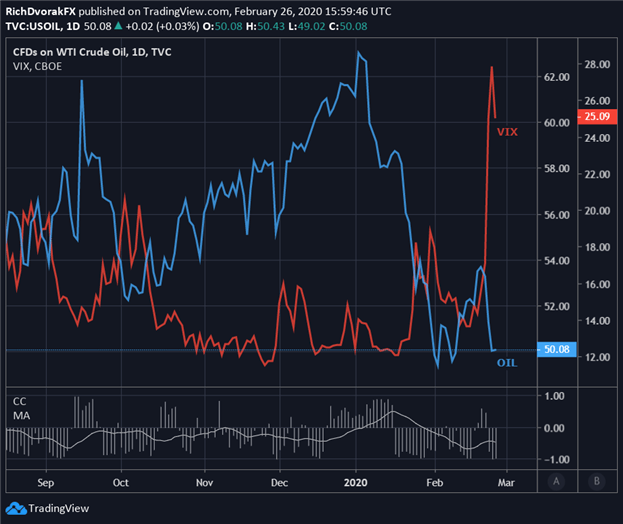
Chart created by @RichDvorakFX with TradingView
Generally, there is an inverse correlation between the direction of volatility and oil prices. As such, measures of market volatility – whether it be equity volatility (VIX Index) or oil volatility (OVX Index) – could serve as possible bellwethers to crude oil price action.
CRUDE OIL PRICE CHART: WEEKLY TIME FRAME (NOVEMBER 2015 TO FEBRUARY 2020)
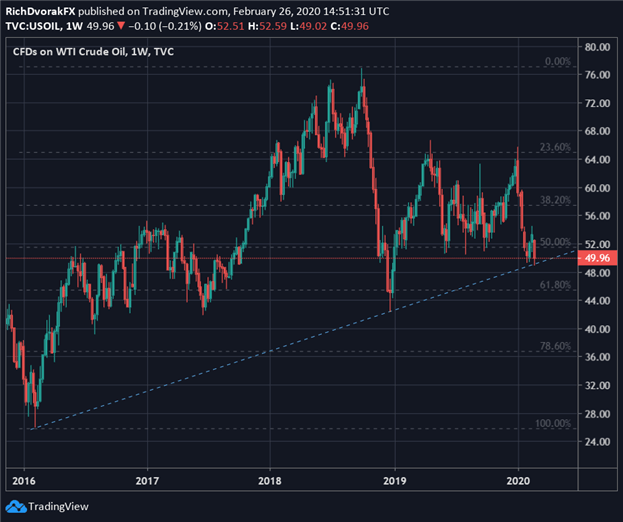
Chart created by @RichDvorakFX with TradingView
That said, a weekly crude oil chart indicates spot prices could be metaphorically standing on the edge of a cliff underpinned by the long-term trendline of support.
If this major level of technical confluence around the psychologically-significant 50.00 handle fails to keep crude oil price action afloat, crude oil could quickly crumble toward the December 2018 lows swing lows.

Another influx of coronavirus concerns or lack of crude oil supply cuts expected to be announced at the OPEC meeting next week could serve as possible fundamental catalysts that steer oil prices back lower.
-- Written by Rich Dvorak, Junior Analyst for DailyFX.com
Connect with @RichDvorakFX on Twitter for real-time market insight


