


Crude Oil Price Forecast Overview:
- As macro headwinds dissipate – the US-China trade war, Brexit – global growth concerns have faded in tandem, helping lift energy prices.
- Crude oil prices have been consolidating in a triangle since October 2018 – a topside breakout may be gathering pace.
- Recent changes in retail trader positioning gives us a stronger crude oil price-bullish contrarian trading bias.

Crude Oil Prices’ Strong December
Energy markets have had a December to remember. As macro headwinds dissipate – the US-China trade war, Brexit – global growth concerns have faded in tandem, helping lift energy prices. Crude oil prices are pacing for their third-best month of the year so far (8.95% month-to-date), trailing behind June (9.01%) and January (18.9%).
Balancing Supply and Demand Against Macro Concerns
For many weeks now, crude oil prices have been walking a fine line supply and demand concerns. On the demand side, agreement to a Phase 1 deal in the US-China trade war, coupled with a rebound in US growth expectations, has alleviated fears that a global recession is imminent. On the supply side, even as US energy inventories continue to build, news that OPEC+ would be reducing production through March 2020 has helped support energy markets.
Economic Calendar Week Ahead Impact on Crude Oil Prices
Outside of the US, the forex economic calendar is saturated in the coming days: the December Bank of Japan rate decision; the Q3’19 New Zealand GDP report; the November Australia jobs report; and the November inflation reports from Canada and the UK.
Yet none will matter as much as the inventory data due out mid-week. Wednesday’s US EIA inventories report has proven to be a veritable source of volatility in energy markets in recent weeks given the surprising amount of excess supply that has been placed in storage. Environments defined by rising inventories are typically bearish for crude oil prices, and yet, crude oil prices are at their highest level since mid-September.
Resiliency by crude oil prices in an environment marked by rising supply in the short-term bodes well for longer-term bullish prospects.
Crude Oil Price Technical Analysis: Daily Chart (October 2018 to December 2019) (Chart 1)
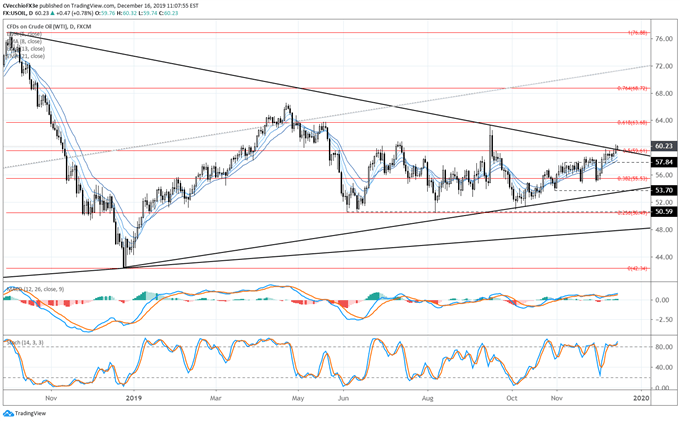
For most of the second half of 2019, crude oil prices have been pinned within a tight trading range, moving between the 23.6% and 50% retracements of the 2018 high/low range, from 50.49 to 59.61. Yet at the end of last week, and with follow-through today, crude oil prices have eclipsed 59.61, and are now making their wave above the descending trendline from the October 2018 and September 2019 highs – resistance in the 14-month long triangle.
Crude oil prices are above their daily 5-, 8-, 13-, and 21-EMA envelope signaling firm bullish momentum. Daily MACD continues to rise in bullish territory, while Slow Stochastics are holding in overbought territory. The momentum profile is clearly bullish, and the path of least resistance is higher for crude oil prices.
Crude Oil Price Technical Analysis: Weekly Chart (December 2015 to December 2019) (Chart 2)
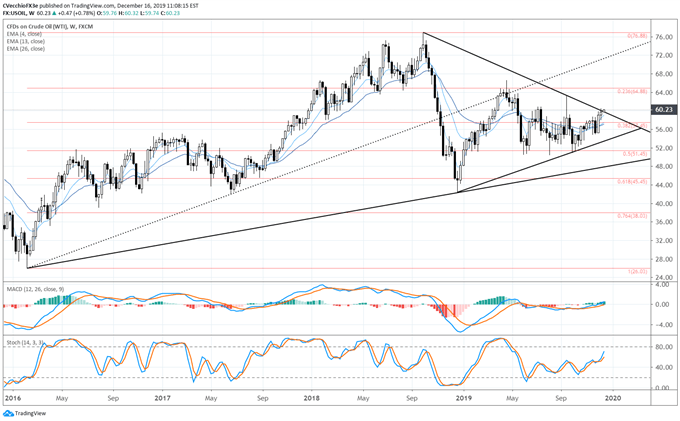
The longer-term crude oil price forecast has not changed – but it’s about to. Crude oil prices are now trading above the rising trendline from the October 2018 and September 2019 highs, signaling a break above symmetrical triangle resistance. On the weekly timeframe, crude oil price momentum is turning higher in a meaningful way. Crude oil prices are extending further above their weekly 4-, 13-, and 26-EMA envelope. Weekly MACD continues to edge higher in bullish territory, and Slow Stochastics are moving towards overbought territory. The multi-month triangle may be on the verge of a topside breakout.
IG Client Sentiment Index: Crude Oil Price Forecast (December 16, 2019) (Chart 3)
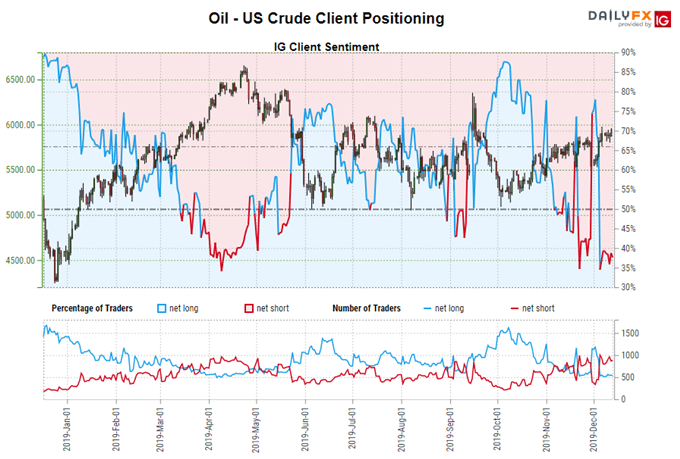
Crude oil: Retail trader data shows 35.32% of traders are net-long with the ratio of traders short to long at 1.83 to 1. The number of traders net-long is 12.03% lower than yesterday and 11.53% lower from last week, while the number of traders net-short is 5.93% lower than yesterday and 4.90% higher from last week.
We typically take a contrarian view to crowd sentiment, and the fact traders are net-short suggests crude oil prices may continue to rise. Traders are further net-short than yesterday and last week, and the combination of current sentiment and recent changes gives us a stronger crude oil price-bullish contrarian trading bias.
| Change in | Longs | Shorts | OI |
| Daily | 0% | -7% | -2% |
| Weekly | -7% | 1% | -5% |
Read more: Weekly US Dollar Forecast: Calendar Winds Down into Year-End
--- Written by Christopher Vecchio, CFA, Senior Currency Strategist
To contact Christopher Vecchio, e-mail at cvecchio@dailyfx.com
Follow him on Twitter at @CVecchioFX
View our long-term forecasts with the DailyFX Trading Guides


