


Crude Oil Technical Analysis
- Brent and WTI crude price charts and analysis
- Crude Oil price action
Have you seen our newest trading guides for USD, EUR and Gold ? Download for free our latest forecasts
Oil Price – Paused Uptrend Move
On Friday, Brent oil rallied to $63.42 – its highest level in nearly two months. However, the price slipped back closing the weekly candlestick with a Doji pattern indicating to the market’s indecision at this stage. Similarly, WTI traded the same way printing its highest price in two months then closed with a Doji pattern as well.
Alongside this, the Relative Strength Index (RSI) crossed above 50 then remained flat, highlighting weak buyers and weaker sellers.
Just getting started? See our Beginners’ Guide for FX traders
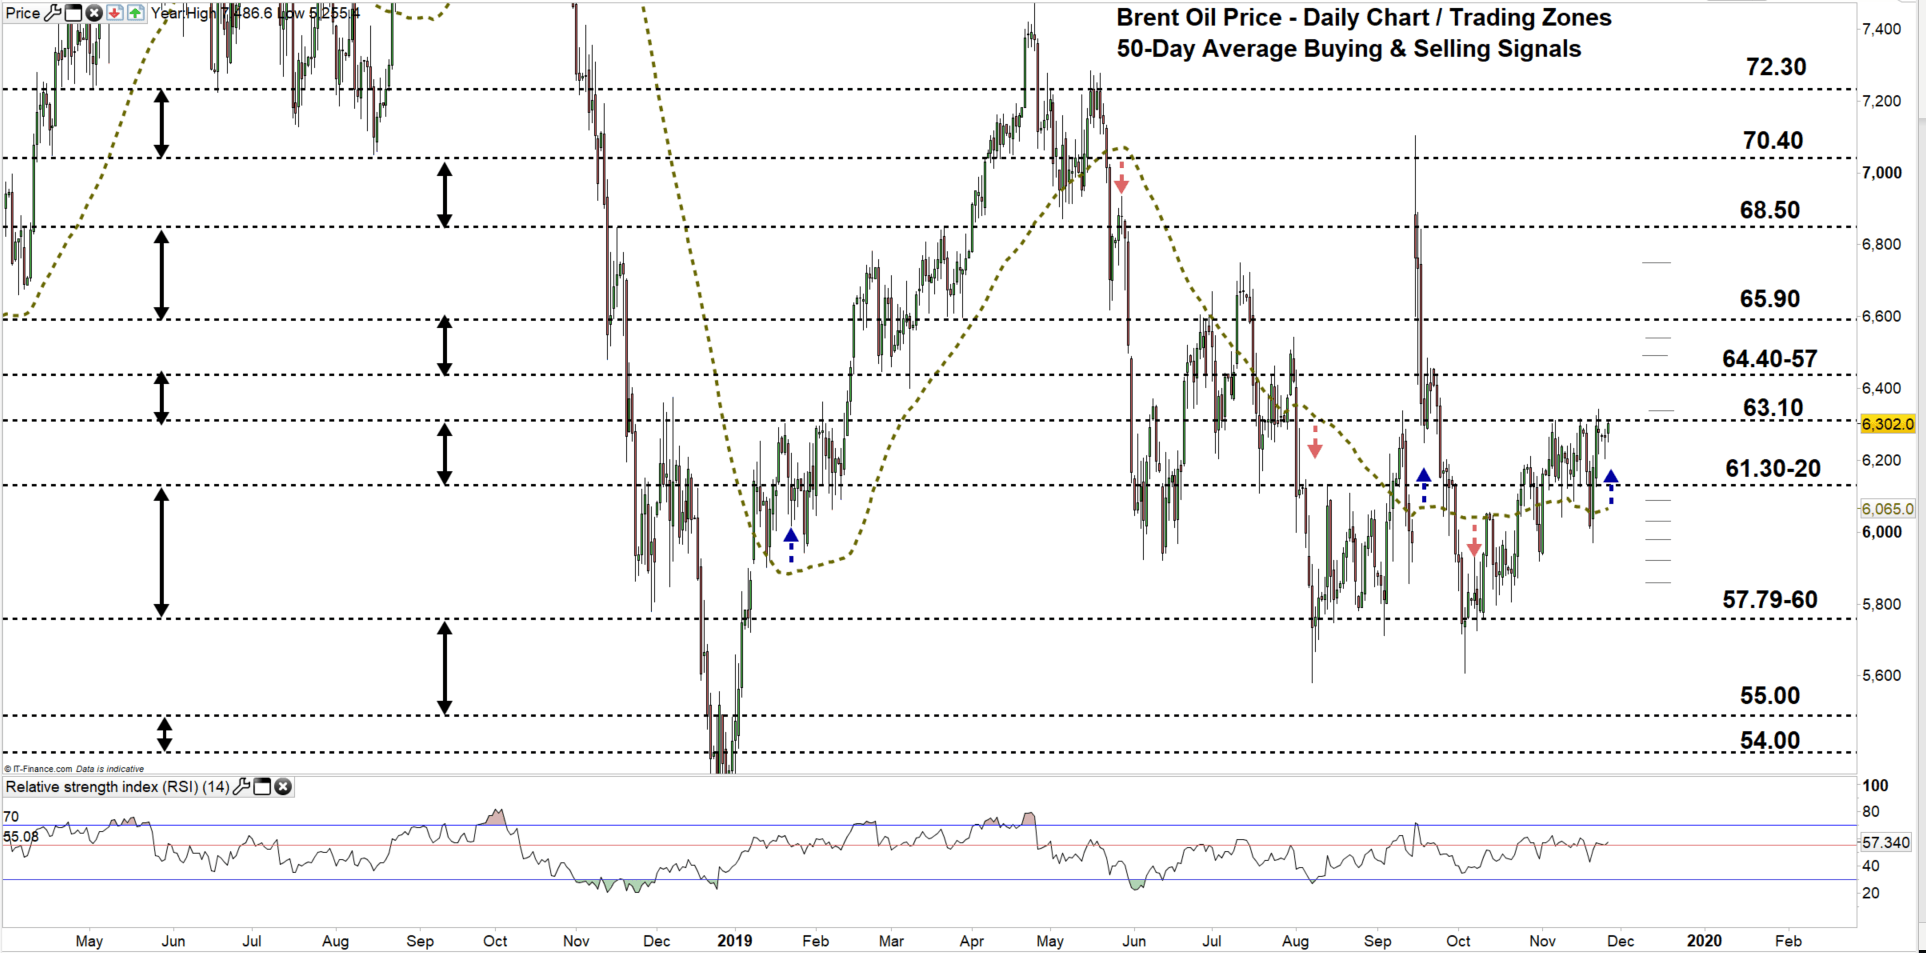
Brent Oil DAILY PRICE CHART (Apr 1, 2018 – NOV 26, 2019) Zoomed Out
Brent Oil DAILY PRICE CHART (Sep 18 – NOV 26, 2019) Zoomed In
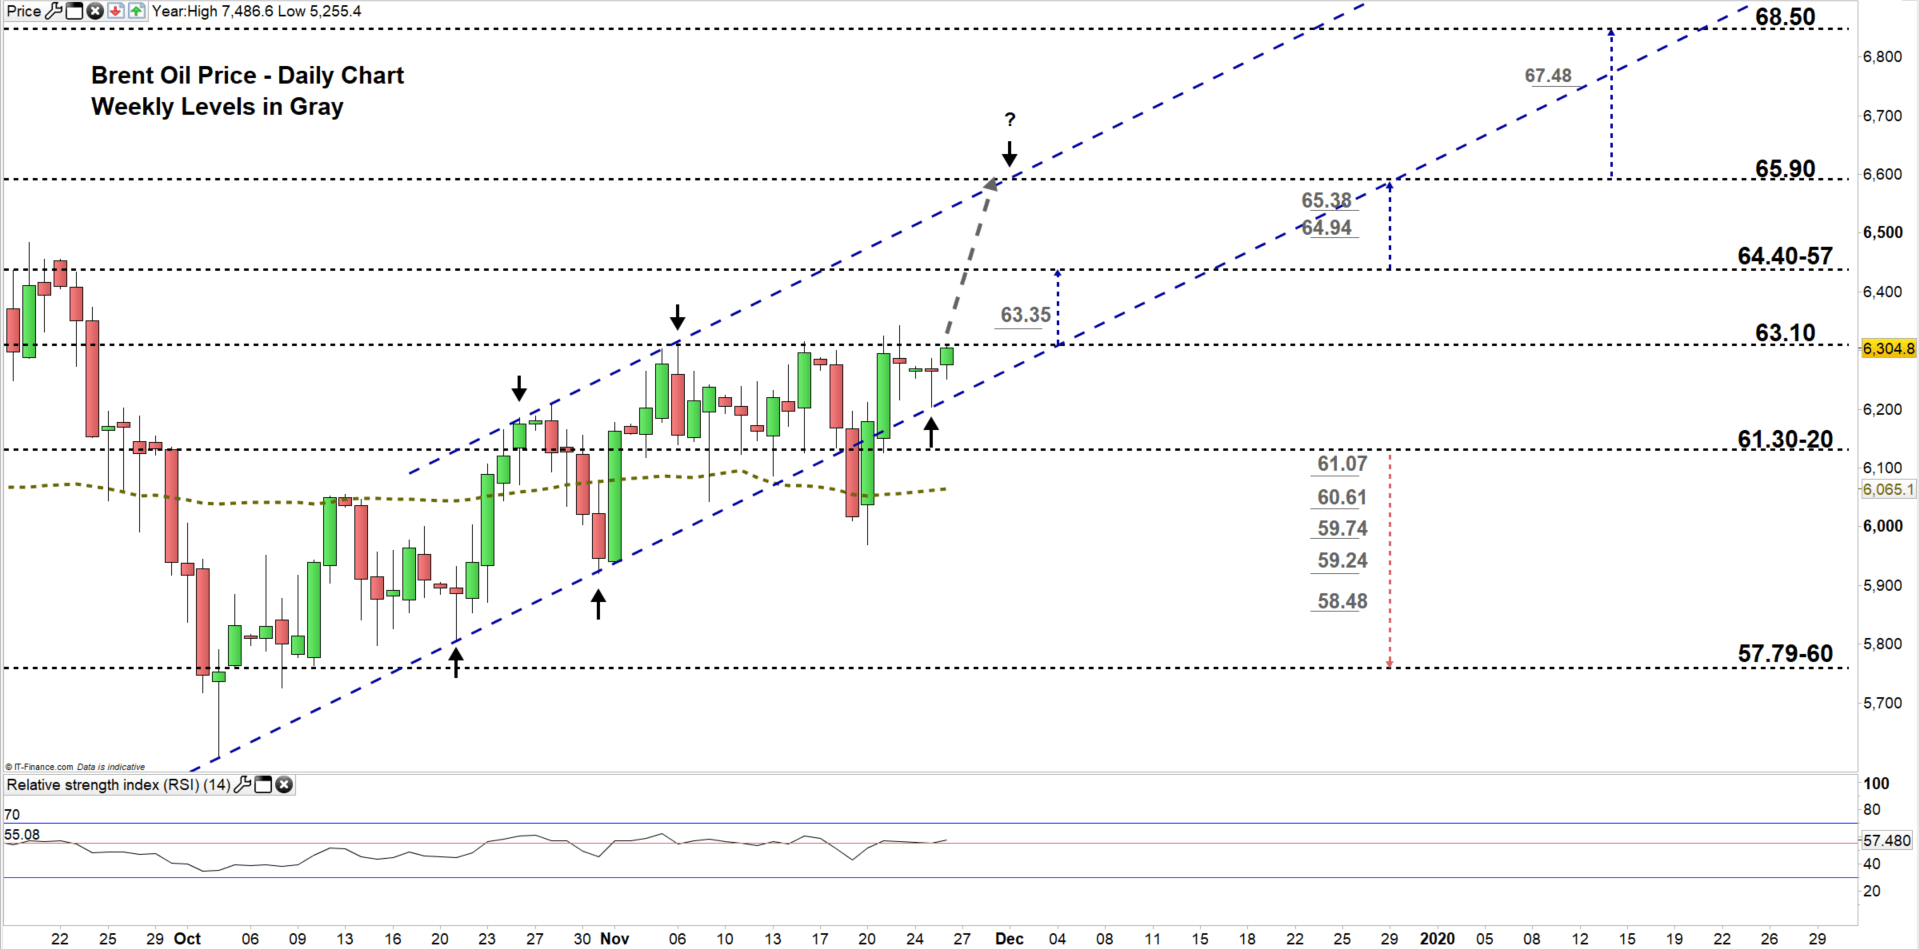
From the daily chart, we notice on Nov 20 Brent oil reversed back to the uptrend channel originated from late Oct, then closed above the 50-day average reflecting the bullish outlook of the market. Yesterday, the price rebounded from the lower line of the channel hinting to a rally towards the upper line of it.
Last week, Brent oil failed twice to rally to the next higher trading zone. This kept the price moving in the trading zone ($61.30 – $63.10) entered on Wednesday.
Today, Brent tests the high end of the zone. Thus, a close above the high end may cause buyers to rally the price towards the vicinity of $64.40-57. Further close above $64.57 could mean more bullishness towards $65.90. That said, the weekly resistance levels underlined on the chart should be considered.
In turn, another close below the high end of the zone could signal buyer’s hesitation. This could reverse the price’s direction towards the low end of the zone. Further close below $61.20 could pave the way for sellers to press towards the vicinity of $57.79-60. Nevertheless, the weekly support levels marked on the chart should be monitored.
Having trouble with your trading strategy? Here’s the #1 Mistake That Traders Make
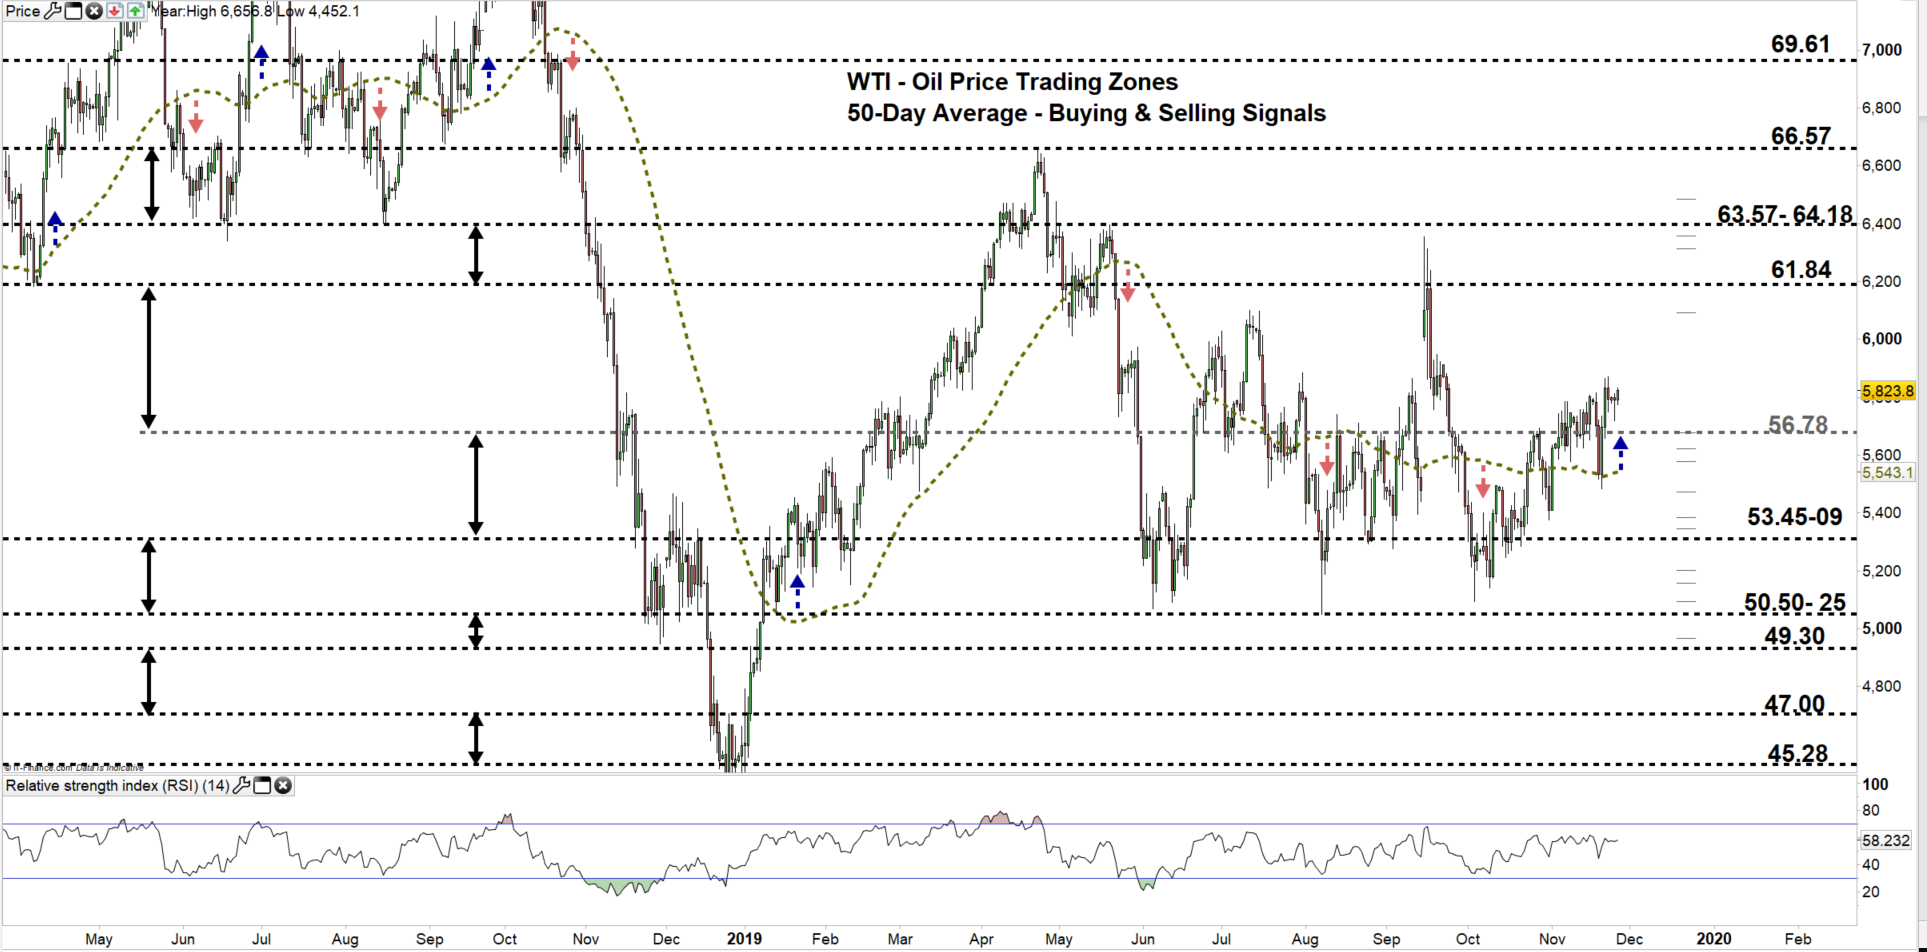
WTI Crude Daily PRICE CHART (ApR 1, 2018 – Nov 26, 2019) Zoomed OUT
WTI Crude Daily PRICE CHART (Sep 10 – Nov 26, 2019) Zoomed IN
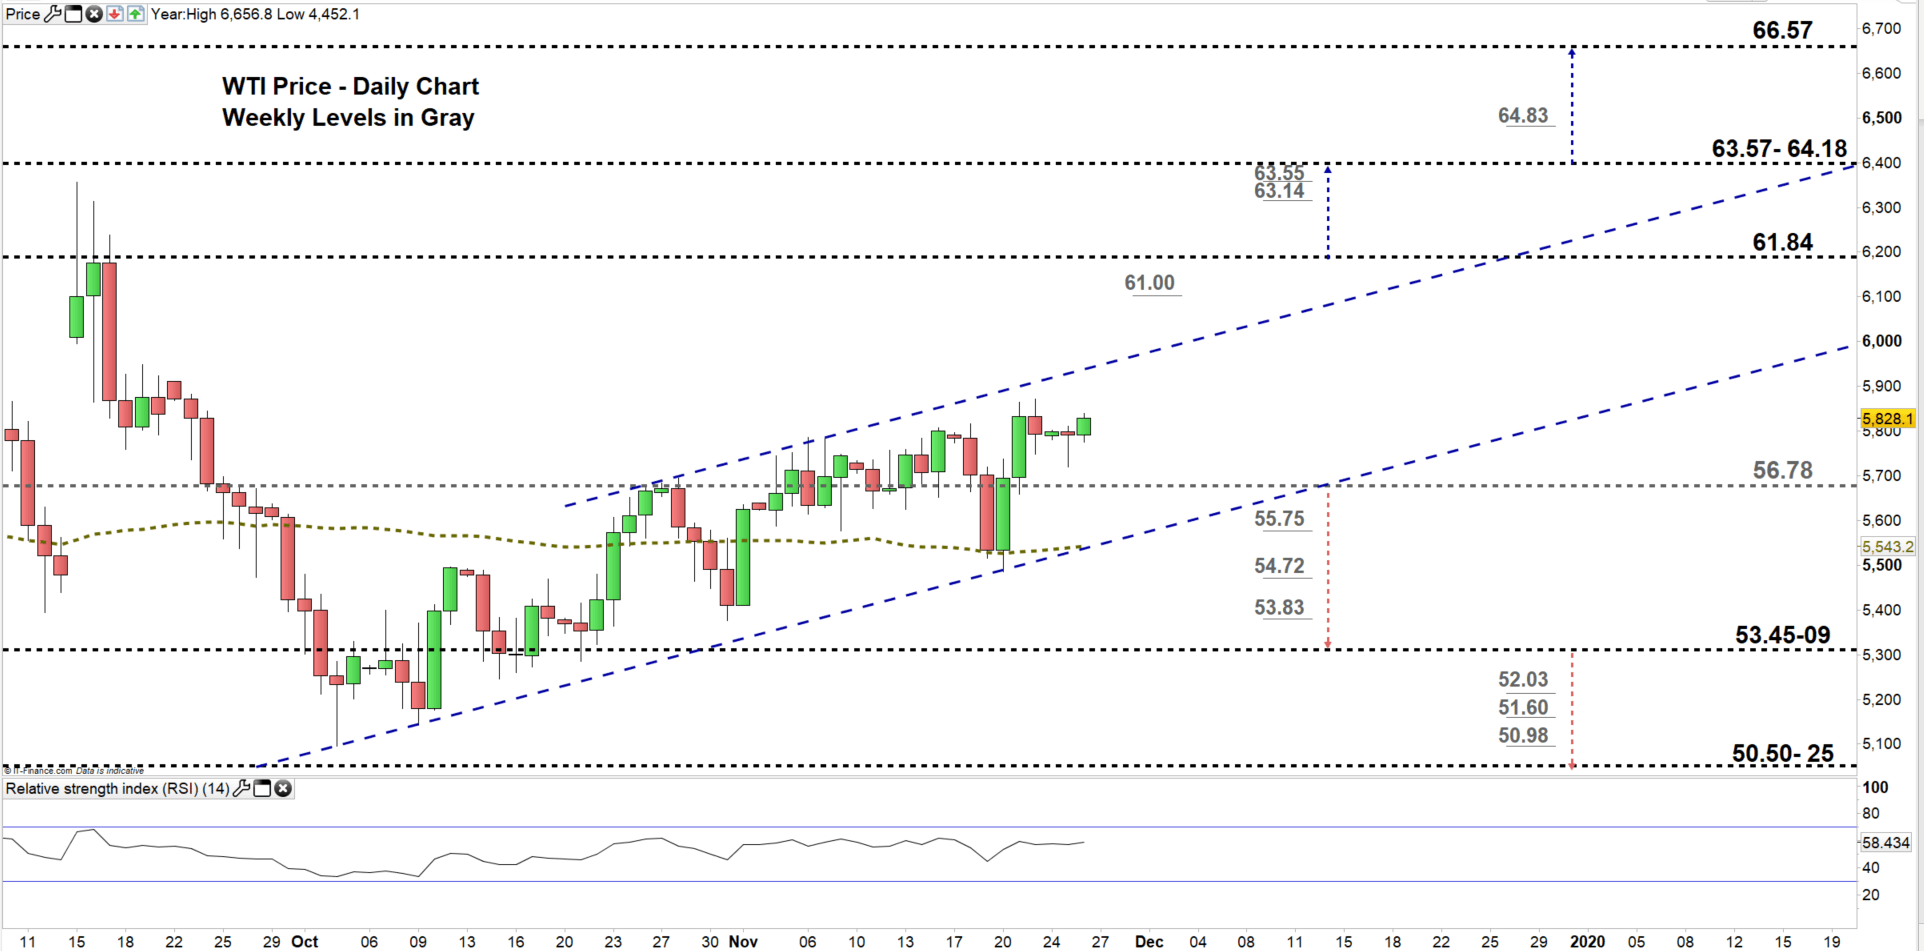
Looking at the daily chart, we notice on Nov 20 WTI rebounded from the uptrend channel originated from early Oct, then closed above the 50-day average eyeing a test of the upper line of the channel.
Additionally, on Nov 21 the price rallied to a higher trading zone $56.78- $61.84. Therefore, the price could be on its way for a test of the high end of the zone. Yet, buyers need to clear the weekly resistance level underlined on the chart (zoomed in).
On the flip-side, any close below the low end of the zone could give the intuitive to sellers to send the price towards the vicinity of $53.45-09. In that scenario, the weekly support levels marked on the chart should be kept in focus.
Written By: Mahmoud Alkudsi
Please feel free to contact me on Twitter: @Malkudsi


