


Crude Oil Price Forecast Overview:
- Crude oil prices have continued their recovery as progress on the US-China trade war front has reduced concerns over global growth. Rising crude oil prices in November have gone in-hand with falling Federal Reserve interest rate cut odds.
- The 5-day correlation between USD/CAD and crude oil prices is -0.04 and the 20-day correlation is -0.45; one week ago, the 5-day correlation was -0.13 and the 20-day correlation was -0.44.
- Recent changes in retail trader positioning gives us a stronger bearish bias for both the Canadian Dollar and crude oil prices, however.
Looking for longer-term forecasts on crude oil prices or the Canadian Dollar? Check out the DailyFX Trading Guides.
Crude oil prices have continued their recovery as progress on the US-China trade war front has reduced concerns over global growth. But there’s more: data out of Europe and North America has started to improve as well. Industrial production figures out of the Eurozone coupled with recent PMI and ISM readings out of the United States suggest that recession fears are overblown in the near-term.
As a result, rising crude oil prices in November have gone in-hand with falling Federal Reserve interest rate cut odds; if Fed rate cut odds increase as global growth concerns rise, then a drop in rate cut odds is not only a positive for the US Dollar, but also for crude oil prices. For the time being, this has skewered the relationship between crude oil prices and USD/CAD rates.
Crude Oil Price Technical Analysis: Daily Chart (November 2018 to November 2019) (Chart 1)
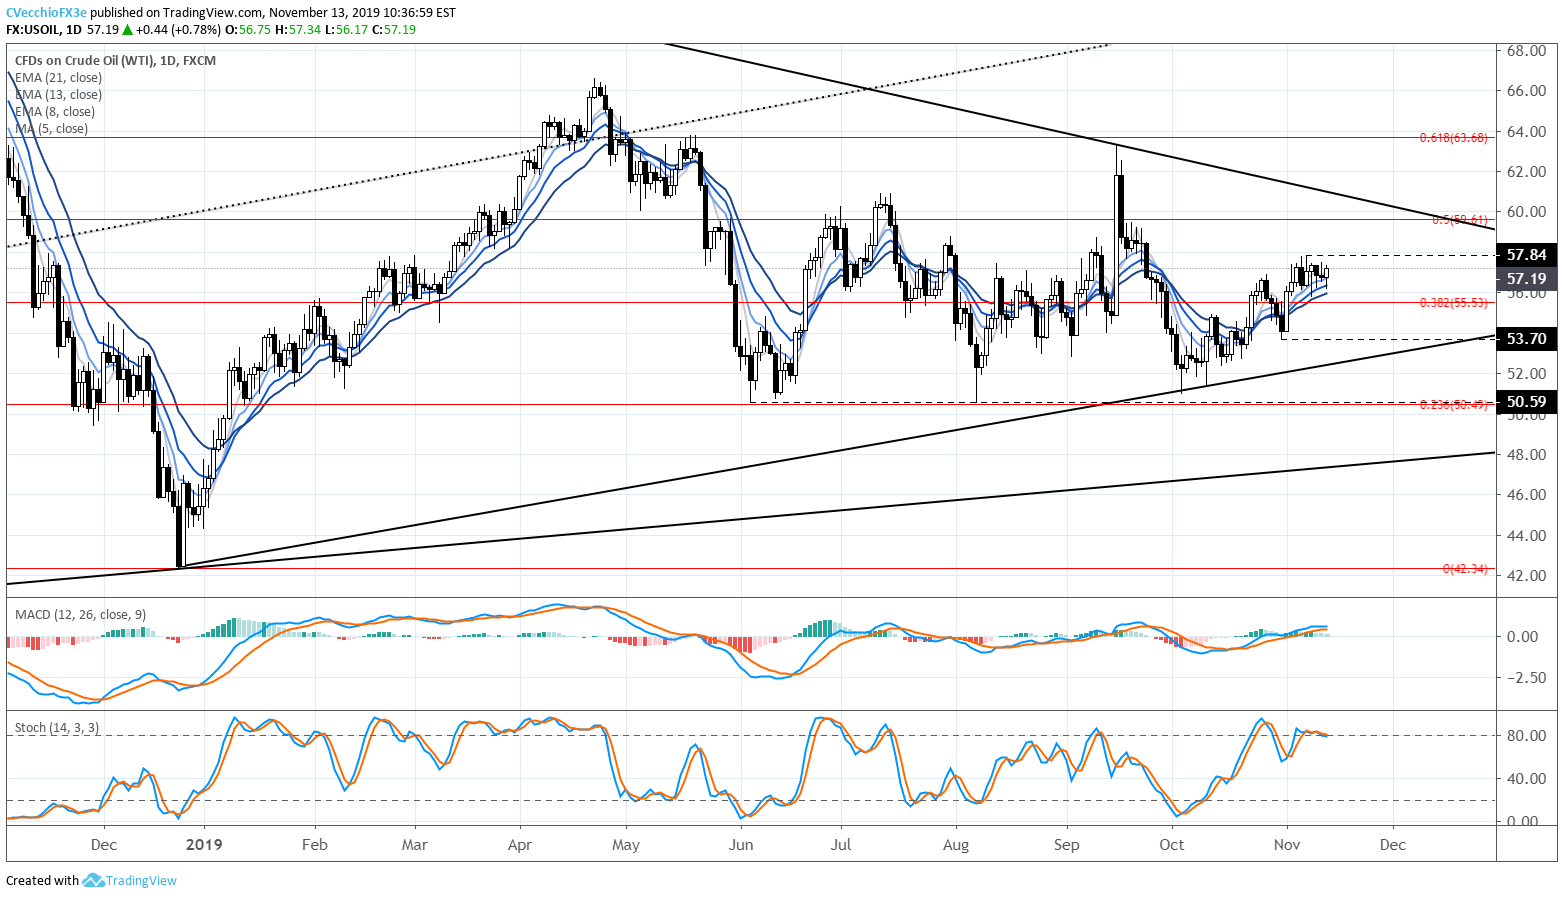
In our last crude oil price forecast technical analysis update on October 31, it was noted that “only a break through 50.49 would warrant a significant consideration of a bearish breakdown.” Such a breakdown never transpired, and instead, crude oil prices have continued to meander higher since the start of November. To this end, as they have been since June, crude oil prices remain trapped between the 23.6% and 50% retracements of the 2018 high/low range, from 50.49 to 59.61.
Crude oil prices are now back above their daily 8-, 13-, and 21-EMA envelope, and bullish momentum is starting to firm up – but only marginally. Daily MACD continues to rise in bullish territory, while Slow Stochastics are lingering in overbought territory. Traders may want to keep an eye on the two-week trading range that has encapsulated price action since October 31, between 53.70 and 57.84 before any further decisions are taken.
Crude Oil Price Technical Analysis: Weekly Chart (December 2015 to November 2019) (Chart 2)
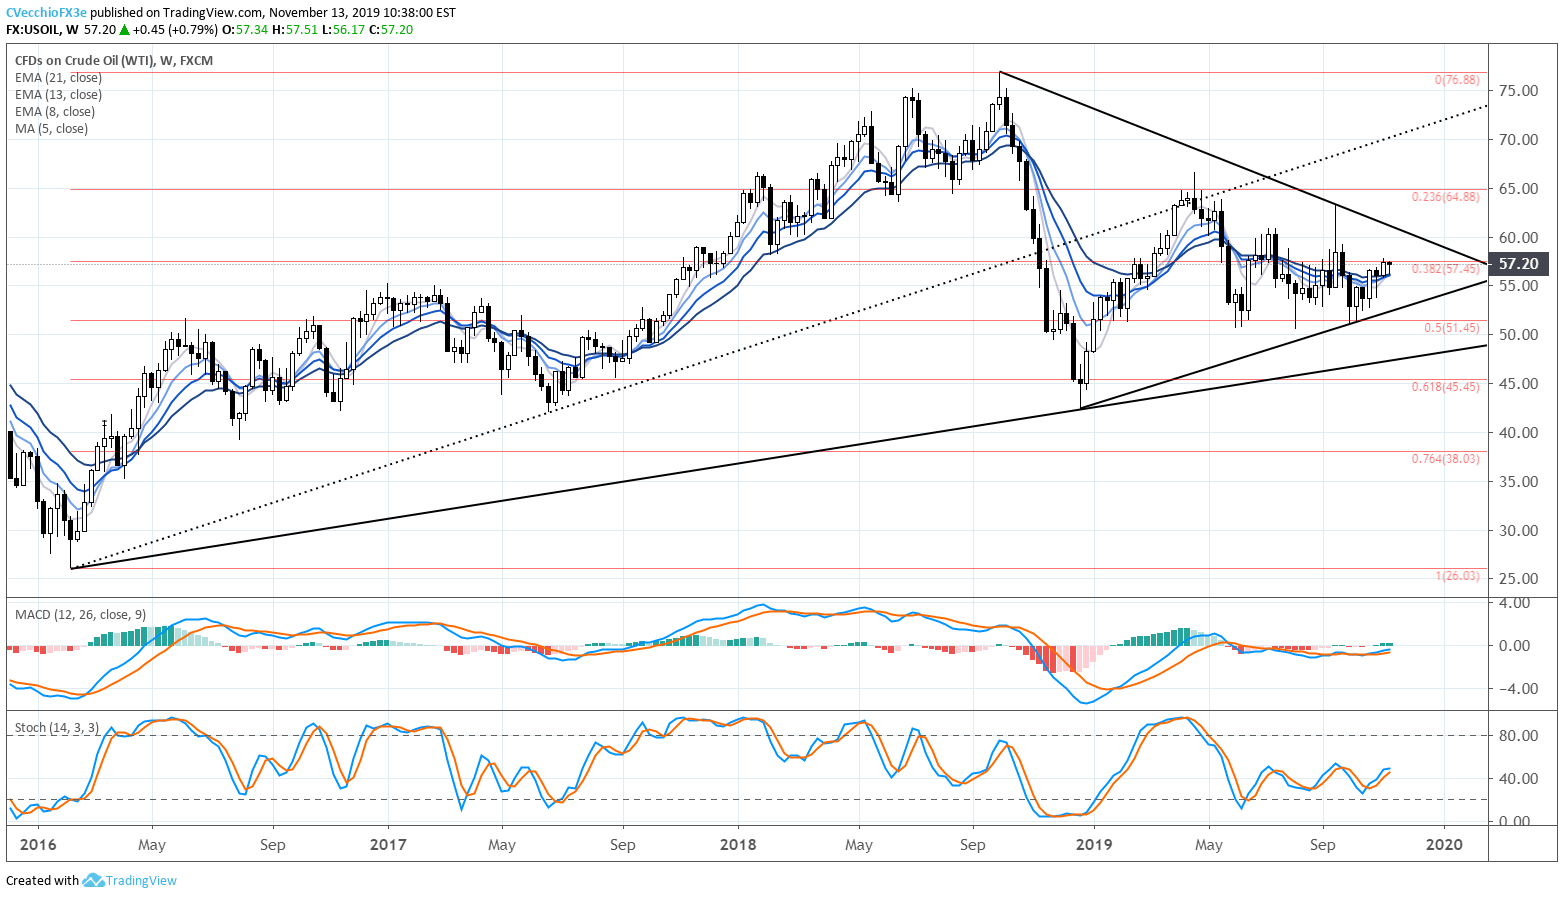
In our last crude oil price forecast technical analysis update on October 31, it was also noted that “more clarity is needed” on the weekly timeframe. Not much has changed. Crude oil prices continue to trade below the rising trendline from the 2016 and 2017 lows, having carved out a symmetrical triangle since the October 2018 high.
Momentum is just starting to turn higher, but remains uninspiring. Crude oil prices are once again above their weekly 8-, 13-, and 21-EMA envelope. But weekly MACD remains in bearish territory, even if it is still trending higher, and Slow Stochastics have returned to their median line. It still holds that more clarity is needed.
IG Client Sentiment Index: Crude Oil Price Forecast (November 13, 2019) (Chart 3)
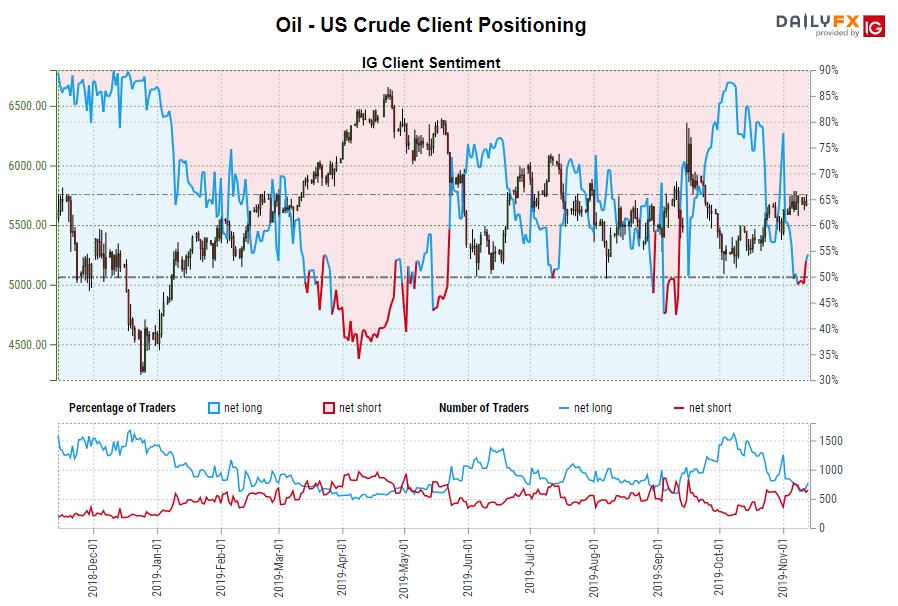
Crude oil: Retail trader data shows 59.02% of traders are net-long with the ratio of traders long to short at 1.44 to 1. The number of traders net-long is 16.76% higher than yesterday and 12.76% higher from last week, while the number of traders net-short is 8.60% lower than yesterday and 25.35% lower from last week.
We typically take a contrarian view to crowd sentiment, and the fact traders are net-long suggests crude oil prices may continue to fall. Traders are further net-long than yesterday and last week, and the combination of current sentiment and recent changes gives us a stronger crude oil-bearish contrarian trading bias.
Relationship Between Crude Oil and Canadian Dollar Strengthening
For a currency with an economy’s whose energy sector constitutes approximately 11% of GDP, the Canadian Dollar historically has been sensitive to movements in crude oil prices. Yet shifts around Federal Reserve interest rate cut pricing, thanks to movement along the US-China trade war front, has gone in-hand with cooled global growth concerns.
The 5-day correlation between USD/CAD and crude oil prices is -0.04 and the 20-day correlation is -0.45; one week ago, the 5-day correlation was -0.13 and the 20-day correlation was -0.44.
USD/CAD Rate Technical Analysis: Daily Chart (November 2018 to November 2019) (Chart 4)
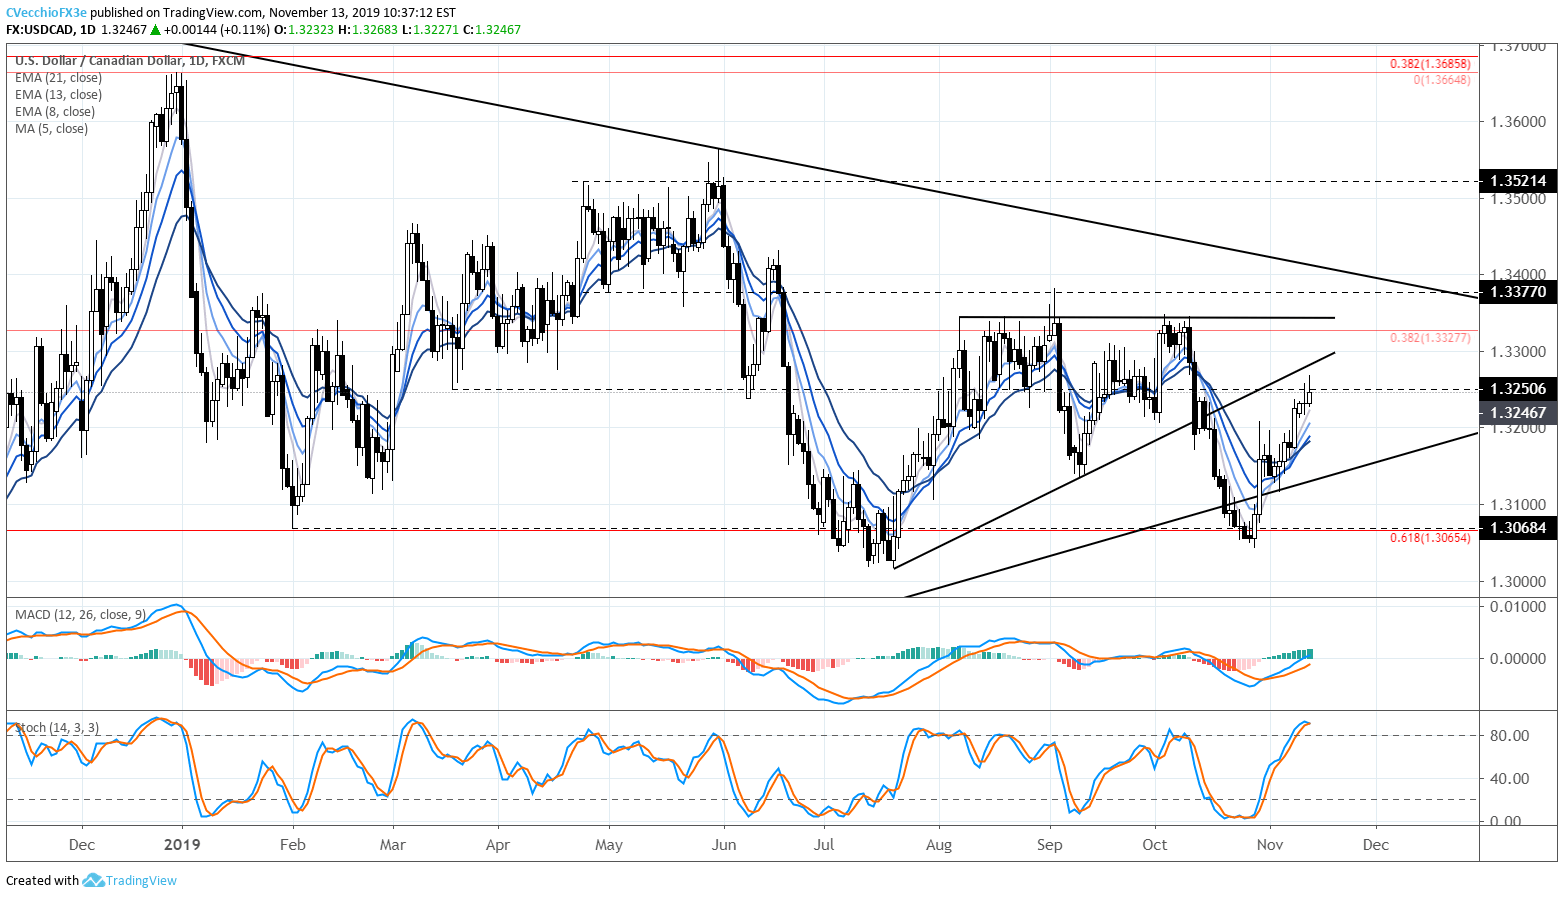
USD/CAD’s rebound has continued since our last update on October 31. USD/CAD remains above the daily 8-, 13-, and 21-EMA envelope, which is now in bullish sequential order. Daily MACD is trending higher through its signal line, while Slow Stochastics have jumped into overbought territory. USD/CAD has reached the March 2019 swing low at 1.3247, where it has found selling pressure each of the past two days. The rising trendline from the July and September 2019 swing lows comes into play near 1.3275 through the remainder of the week.
USD/CAD Rate Technical Analysis: Weekly Chart (November 2018 to November 2019) (Chart 5)
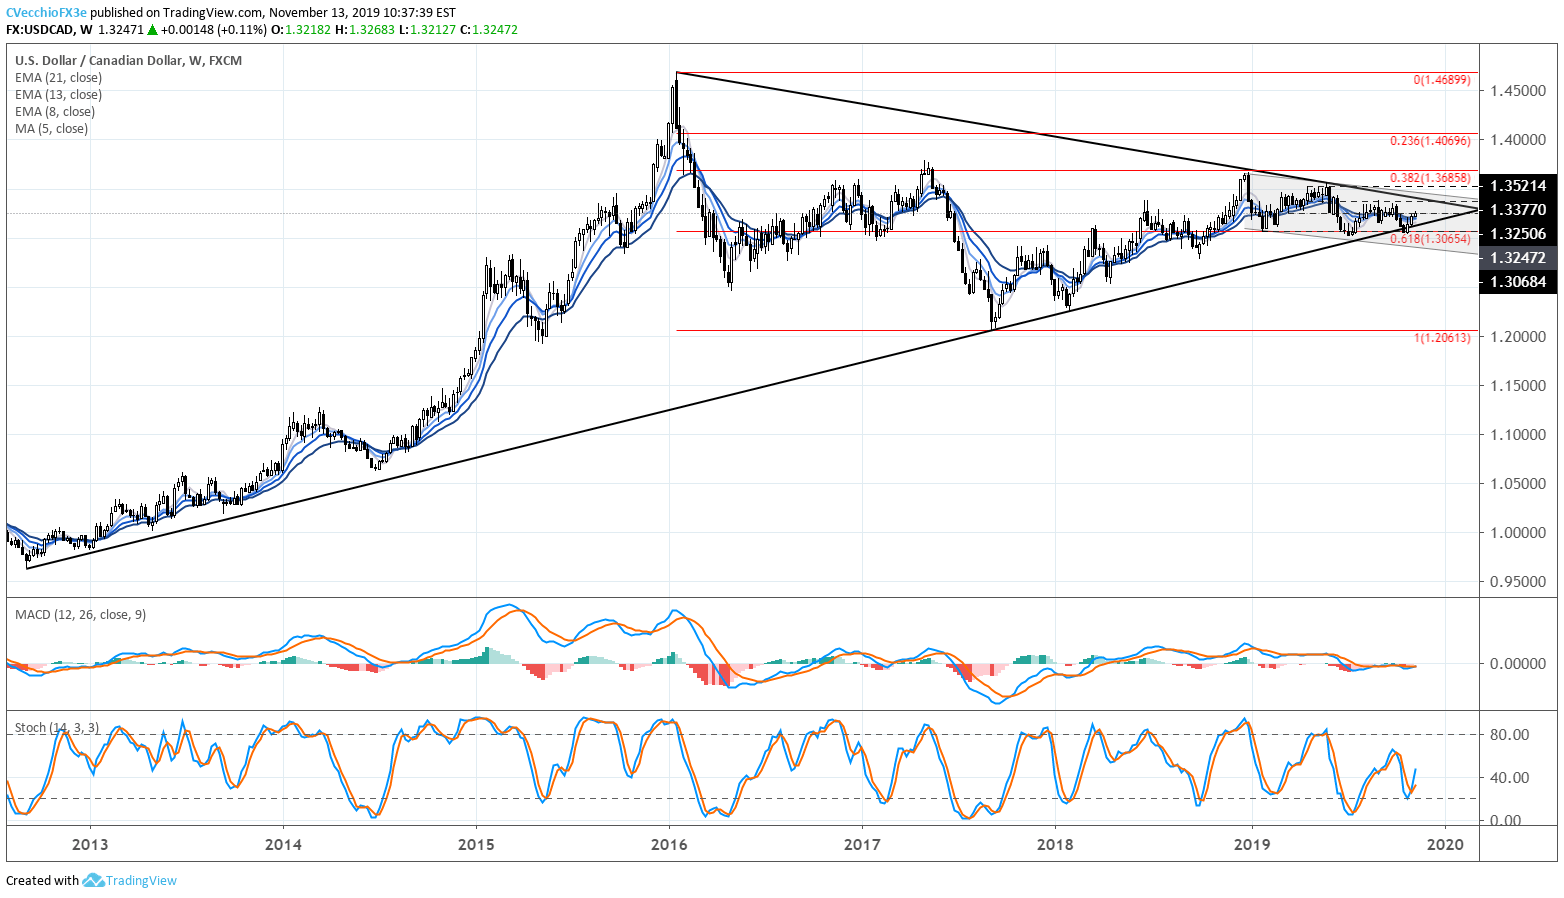
USD/CAD’s rebound in November comes after the pair found two significant support regions at the end of October. First, USD/CAD rates found support on the trendline from the 2012 and 2017 lows. Second, USD/CAD was able to turn higher from the 61.8% retracement of the 2016 high to 2018 low range at 1.3065.
With gains over the past two weeks, USD/CAD is turning above its weekly 8-, 13-, and 21-EMA envelope. Weekly MACD is just turning higher but remains below its signal line. Meanwhile, Slow Stochastics is turning higher, although remains below its median line. The longer-term bearish potential for USD/CAD remains, but is not the primary focus at present time.
IG Client Sentiment Index: USD/CAD Rate Forecast (November 13, 2019) (Chart 6)
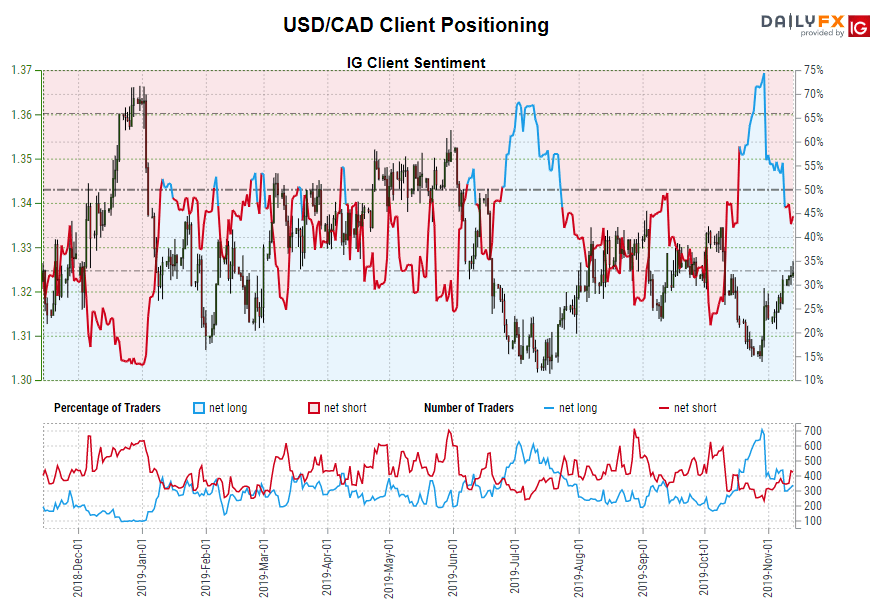
USD/CAD: Retail trader data shows 38.99% of traders are net-long with the ratio of traders short to long at 1.56 to 1. The number of traders net-long is 10.70% lower than yesterday and 29.40% lower from last week, while the number of traders net-short is 11.96% higher than yesterday and 40.91% higher from last week.
We typically take a contrarian view to crowd sentiment, and the fact traders are net-short suggests USD/CAD prices may continue to rise. Traders are further net-short than yesterday and last week, and the combination of current sentiment and recent changes gives us a stronger USD/CAD-bullish contrarian trading bias.
Read more: Bitcoin Price Correlations with Emerging Markets FX: USD/CNH, USD/ZAR Take the Lead
FX TRADING RESOURCES
Whether you are a new or experienced trader, DailyFX has multiple resources available to help you: an indicator for monitoring trader sentiment; quarterly trading forecasts; analytical and educational webinars held daily; trading guides to help you improve trading performance, and even one for those who are new to FX trading.
--- Written by Christopher Vecchio, CFA, Senior Currency Strategist
To contact Christopher Vecchio, e-mail at cvecchio@dailyfx.com
Follow him on Twitter at @CVecchioFX
View our long-term forecasts with the DailyFX Trading Guides


