


Crude Oil Price Forecast Overview:
- Despite the enthusiasm across most asset classes during the second half of October, energy markets have proven rather downtrodden. Crude oil prices have traded lower every day over the past week, despite signs that the US-China trade war was nearing an important turning point.
- The 5-day correlation between USD/CAD and crude oil prices is -0.90 and the 20-day correlation is -0.80.
- Recent changes in retail trader positioning gives us a stronger crude oil price-bearish contrarian trading bias and a mixed USD/CAD trading bias.
Looking for longer-term forecasts on oil prices or the Canadian Dollar? Check out the DailyFX Trading Guides.
Despite the enthusiasm across most asset classes during the second half of October, energy markets have proven rather downtrodden. Crude oil prices have traded lower every day over the past week, despite plenty of remarks from US President Trump that the US-China trade war was nearing an important turning point. Crude oil, which serves as a proxy for global growth expectations, has not bought into the narrative that a Phase One trade deal will be signed, but perhaps more importantly, that it won’t matter for global growth.
The latest developments – essentially bringing the American-Sino trading relationship back to its position in early-2017, before the US-led saber rattling began – suggest that the end to the US-China trade war won’t bring about a boon for the global economy. Instead, back to the status quo would likely translate to more middling gr
Crude Oil Price Technical Analysis: Daily Chart (October 2018 to October 2019) (Chart 1)
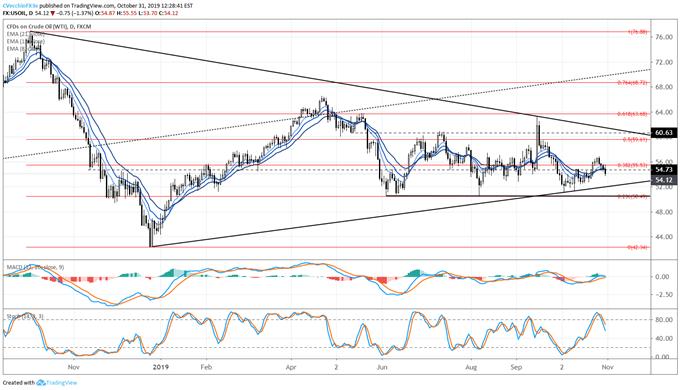
Crude oil prices have spent the month of October trading sideways – no different than the past several months. Sine June, crude oil prices have been trapped between the 23.6% and 50% retracements of the 2018 high/low range, from 50.49 to 59.61. Any significant concerns about a potential supply shock after the news of the drone attack on Saudi Arabia’s Abqaiq facility have been eliminated, as price reflects as much.
Crude oil prices are now back below their daily 8-, 13-, and 21-EMA envelope, but bearish momentum is very soft. Daily MACD continues to rise although has started to turn near the signal line (currently in both bullish and bearish territory), while Slow Stochastics have just started to pullback from overbought territory. Only a break through 50.49 would warrant aa significant consideration of a bearish breakdown.
Crude Oil Price Technical Analysis: Weekly Chart (October 2015 to October 2019) (Chart 2)
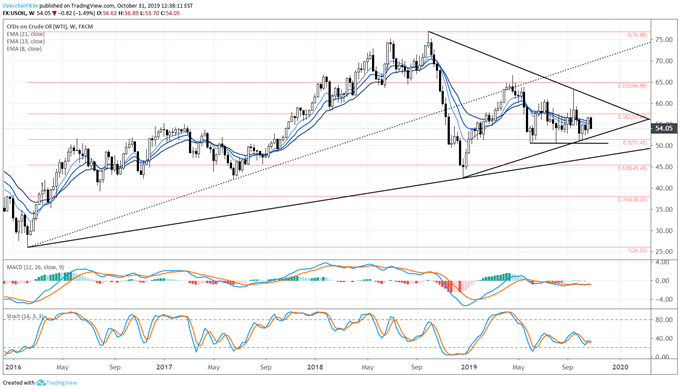
The failed bullish breakout from the descending triangle in place since the end of September 2018 and May 2019 has shifted focus once again to the downside. But prices have failed to gain any traction, although prices have may have a downside bias, continuing to trade below the rising trendline from the 2016 and 2017 lows. Crude oil prices are back below their weekly 8-, 13-, and 21-EMA envelope. Meanwhile, weekly MACD has started to turn lower in bearish territory (just below the signal line), and Slow Stochastics have narrowed just above oversold territory. More clarity is needed.
IG Client Sentiment Index: Crude Oil Price Forecast (October 31, 2019) (Chart 3)
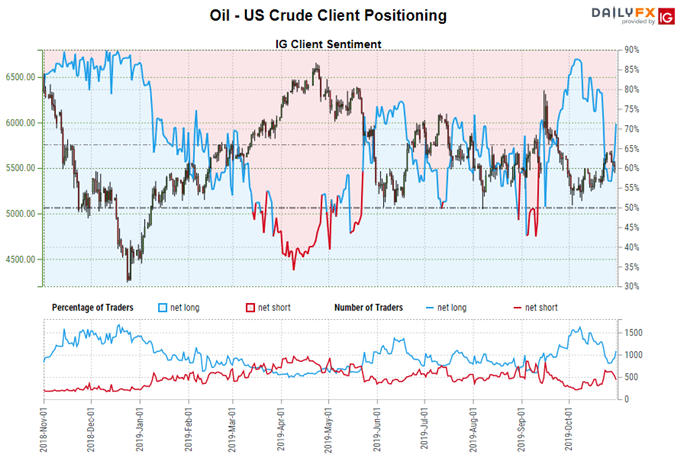
Crude oil prices: Retail trader data shows 77.45% of traders are net-long with the ratio of traders long to short at 3.43 to 1. The number of traders net-long is 28.87% higher than yesterday and 24.25% higher from last week, while the number of traders net-short is 26.86% lower than yesterday and 33.98% lower from last week.
We typically take a contrarian view to crowd sentiment, and the fact traders are net-long suggests crude oil prices may continue to fall. Traders are further net-long than yesterday and last week, and the combination of current sentiment and recent changes gives us a stronger crude oil prices-bearish contrarian trading bias.
Relationship Between Crude Oil and Canadian Dollar Strengthening
For a currency with an economy’s whose energy sector constitutes approximately 11% of GDP, the Canadian Dollar historically has been sensitive to movements in crude oil prices. The current 5-day correlation between USD/CAD and crude oil prices is -0.90 and the 20-day correlation is -0.80; four weeks ago, on October 3, the 5-day correlation is -0.80 and the 20-day correlation is -0.32.
USD/CAD Rate Technical Analysis: Daily Chart (October 2018 to October 2019) (Chart 4)
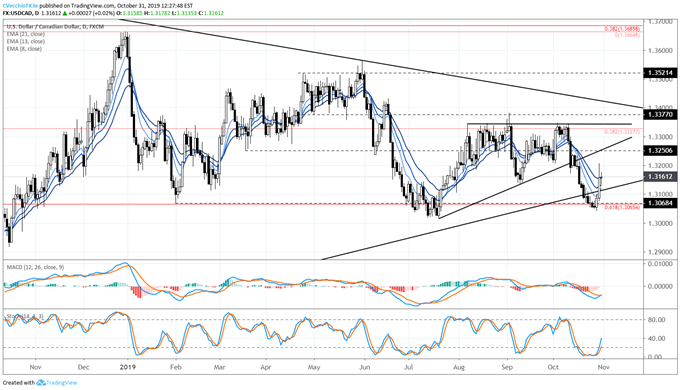
The shift in tone by the Bank of Canada coupled with the weakness in crude oil prices has given USD/CAD good cause to rebound in recent days. USD/CAD is now above the daily 8-, 13-, and 21-EMA envelope (albeit not in bullish sequential order). Daily MACD is turning higher below (albeit in bearish territory), while Slow Stochastics have just moved up out of oversold territory. The area where USD/CAD found support this week is important two-fold, as seen on the weekly chart.
USD/CAD Rate Technical Analysis: Weekly Chart (October 2018 to October 2019) (Chart 5)
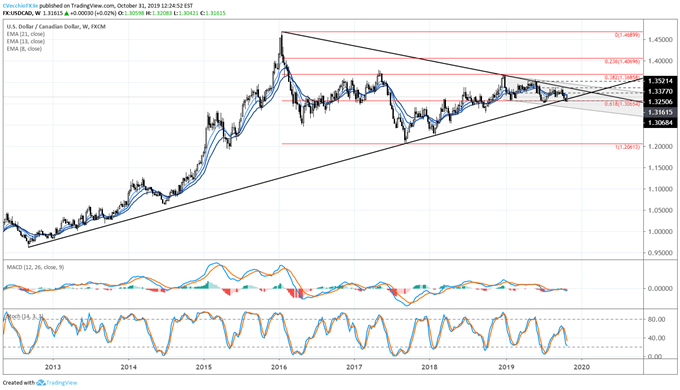
There are two major support regions that came into play for USD/CAD this week. First, USD/CAD rates found support on the trendline from the 2012 and 2017 lows. Additionally, USD/CAD was able to turn higher from the 61.8% retracement of the 2016 high to 2018 low range at 1.3065.
For now, USD/CAD is below the weekly 8-, 13-, and 21-EMA envelope. Weekly MACD is just turning lower below its signal line. Meanwhile, Slow Stochastics continue to shift to the downside. Near-term gains by USD/CAD may be masking more significant bearish potential on a longer-term basis.
IG Client Sentiment Index: USD/CAD Rate Forecast (October 31, 2019) (Chart 6)
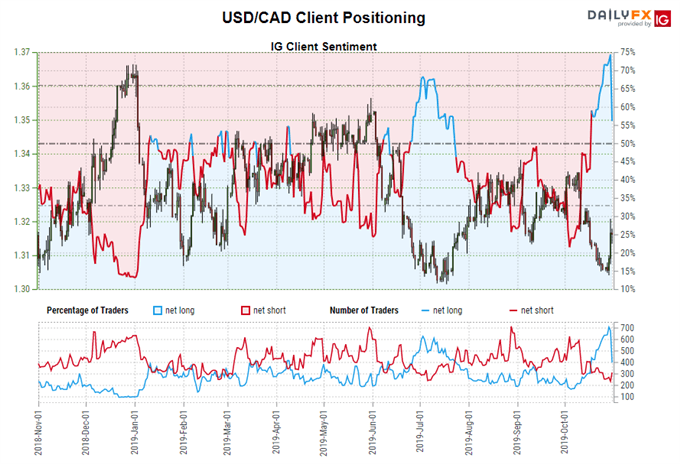
USD/CAD: Retail trader data shows 31.9% of traders are net-long with the ratio of traders short to long at 2.13 to 1. In fact, traders have remained net-short since September 12 when USD/CAD traded near 1.3197; price has moved 0.3% higher since then. The number of traders net-long is 2.9% lower than yesterday and 13.7% lower from last week, while the number of traders net-short is 4.8% lower than yesterday and 9.2% higher from last week.
We typically take a contrarian view to crowd sentiment, and the fact traders are net-short suggests USD/CAD prices may continue to rise. Positioning is less net-short than yesterday but more net-short from last week. The combination of current sentiment and recent changes gives us a further mixed USD/CAD trading bias.
FX TRADING RESOURCES
Whether you are a new or experienced trader, DailyFX has multiple resources available to help you: an indicator for monitoring trader sentiment; quarterly trading forecasts; analytical and educational webinars held daily; trading guides to help you improve trading performance, and even one for those who are new to FX trading.
--- Written by Christopher Vecchio, CFA, Senior Currency Strategist
To contact Christopher Vecchio, e-mail at cvecchio@dailyfx.com
Follow him on Twitter at @CVecchioFX
View our long-term forecasts with the DailyFX Trading Guides


