


CRUDE OIL PRICES SKYROCKET ON SAUDI PIPELINE ATTACK, SUPPLY SHOCK FEARS
- Crude oil prices topped 63.00/bbl for the second time on Monday as commodity traders weigh the shock to global supply from the recent Saudi Aramco attack and Middle East instability
- Spiking crude oil prices threaten to undermine an already weak global economy
- Check out the Top Crude Oil Facts Every Trader Should Know
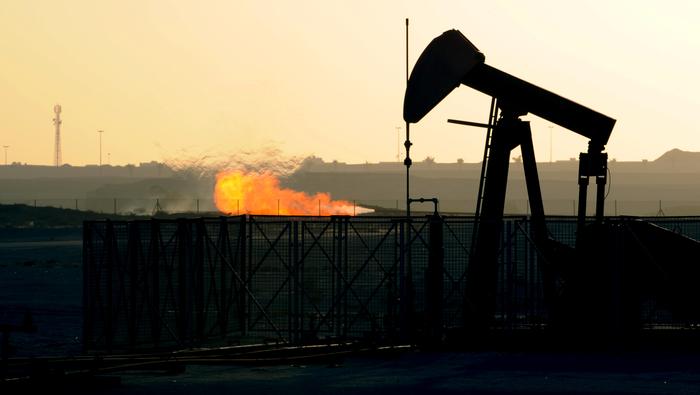
The price of crude oil printed a record-setting spike higher when markets came back online following this past weekend’s developments in of the Middle East. Crude oil prices soared nearly 20% at the open as traders reacted to crippling news that Saudi Arabia’s largest oil processing facility, Aramco, was attacked by a drone strike. The damage to Aramco’s pipeline infrastructure stands to wipe out approximately 5.7 million barrels of output per day, or 5% of global oil supply, and is being labeled as one of the largest single unexpected disruptions in history.
CRUDE OIL PRICE VS OIL PRICE VOLATILITY INDEX CHART OVERLAY: WEEKLY TIME FRAME (AUGUST 2010 TO SEPTEMBER 2019)
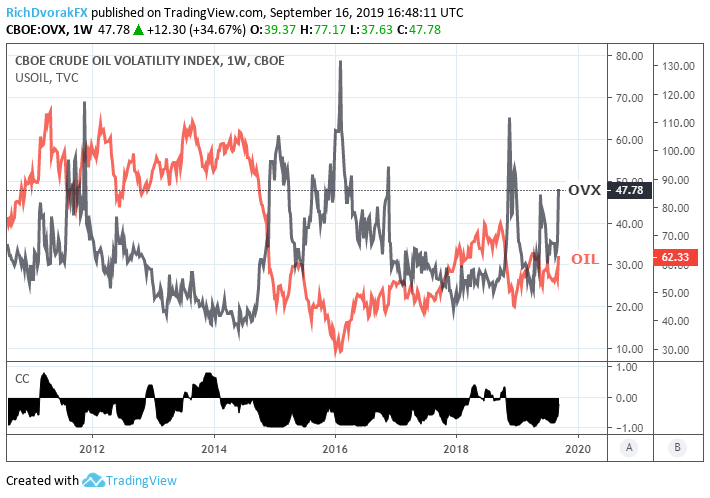
Chart created by @RichDvorakFX with TradingView
OVX, Cboe’s 30-day implied crude oil price volatility index, also climbed exponentially as markets reacted to the latest turmoil in the Middle East. Although there is typically an inverse relationship between implied volatility and risky assets, spot crude price action and oil volatility today provides us with an example that this general rule does not always hold.
This anomaly is also reflected by the less negative correlation between OVX and crude oil prices. If market angst surrounding crude oil supply shock risk accelerates further – likely owing to escalating tensions between OPEC member countries like Saudi Arabia and Iran – this recent trend may continue driving both crude oil prices and oil volatility higher.
OIL PRICE VOLATILITY INDEX VS VIX INDEX CHART OVERLAY: WEEKLY TIME FRAME (JUNE 2014 TO SEPTEMBER 2019)
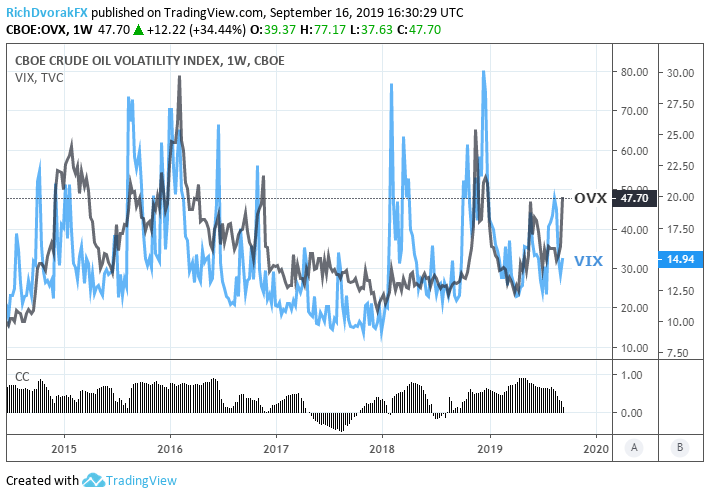
Chart created by @RichDvorakFX with TradingView
The abnormal shift in the correlation measures for OVX can also be observed relative to the VIX Index, Cboe’s 30-day implied volatility for the S&P 500, which is the market’s most popular volatility benchmark and favorite fear-gauge. The normally positive correlation between oil volatility and the VIX has waned recently but will likely return back to the historically strong direct relationship over time.
If Saudi Aramco can get its facility back online quickly and limit the impact on its daily oil output, the move higher in crude oil prices and volatility could be short-lived. On the other hand, it may take longer for the world’s largest oil production facility to restore operations back to normal. Meanwhile, fears of escalating tension across the Middle East – likely already elevated due to recent conflicts in the Strait of Hormuz – threatens to keep volatility and crude oil prices propped up over the near-term.
OIL PRICE VOLATILITY VS S&P 500 INDEX CHART OVERLAY: DAILY TIME FRAME (DECEMBER 2010 TO JANUARY 2012)
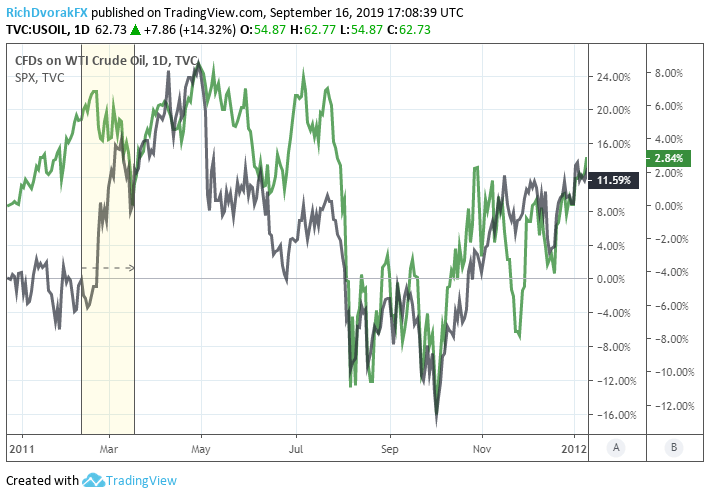
Chart created by @RichDvorakFX with TradingView
We have previously drawn attention to how volatility breakouts threaten risk assets, and the latest surge in crude oil price volatility also has potential to sour market sentiment. Drawing upon recent history for anecdotal evidence, the current fundamental backdrop is eerily similar to early and mid-2011. At that time, the economy was already on fragile footing coming out of the Global Financial Crisis while markets awaited clarity on the magnitude of Fed monetary policy accommodation with central banks entering a new era of unconventional stimulus measures – like quantitative easing.
The period also experienced its own crude oil supply shock stemming from tensions in the Middle East as well as the civil war in Libya. The US stock market, measured via the S&P 500 Index, slipped over 5% when crude oil spiked roughly 20% during February and March 2011. That said, it is not inconceivable that current market dynamics revolving murky monetary policy outlook as well as serious oil supply shock risk and their wide-spanning effects on the global economy threaten markets.
-- Written by Rich Dvorak, Junior Analyst for DailyFX.com
Connect with @RichDvorakFX on Twitter for real-time market insight


